AI Integration
Pro Feature
AI context files require a Pro license.
Use AI assistants to analyze your performance data and get optimization suggestions.
How It Works
Dział zatytułowany „How It Works”GalataJ automatically creates context files that AI assistants can read:
your-project/├── .galataj/│ ├── live-performance.md ← Current profiling data│ └── baseline-live-compare.md ← Comparison with baselinePoint your AI assistant to these files and ask performance questions.
Live Performance File
Dział zatytułowany „Live Performance File”live-performance.md contains real-time profiling data formatted for AI:
- Top methods by CPU time
- Call counts and allocations
- JVM runtime summary
- Context detection results
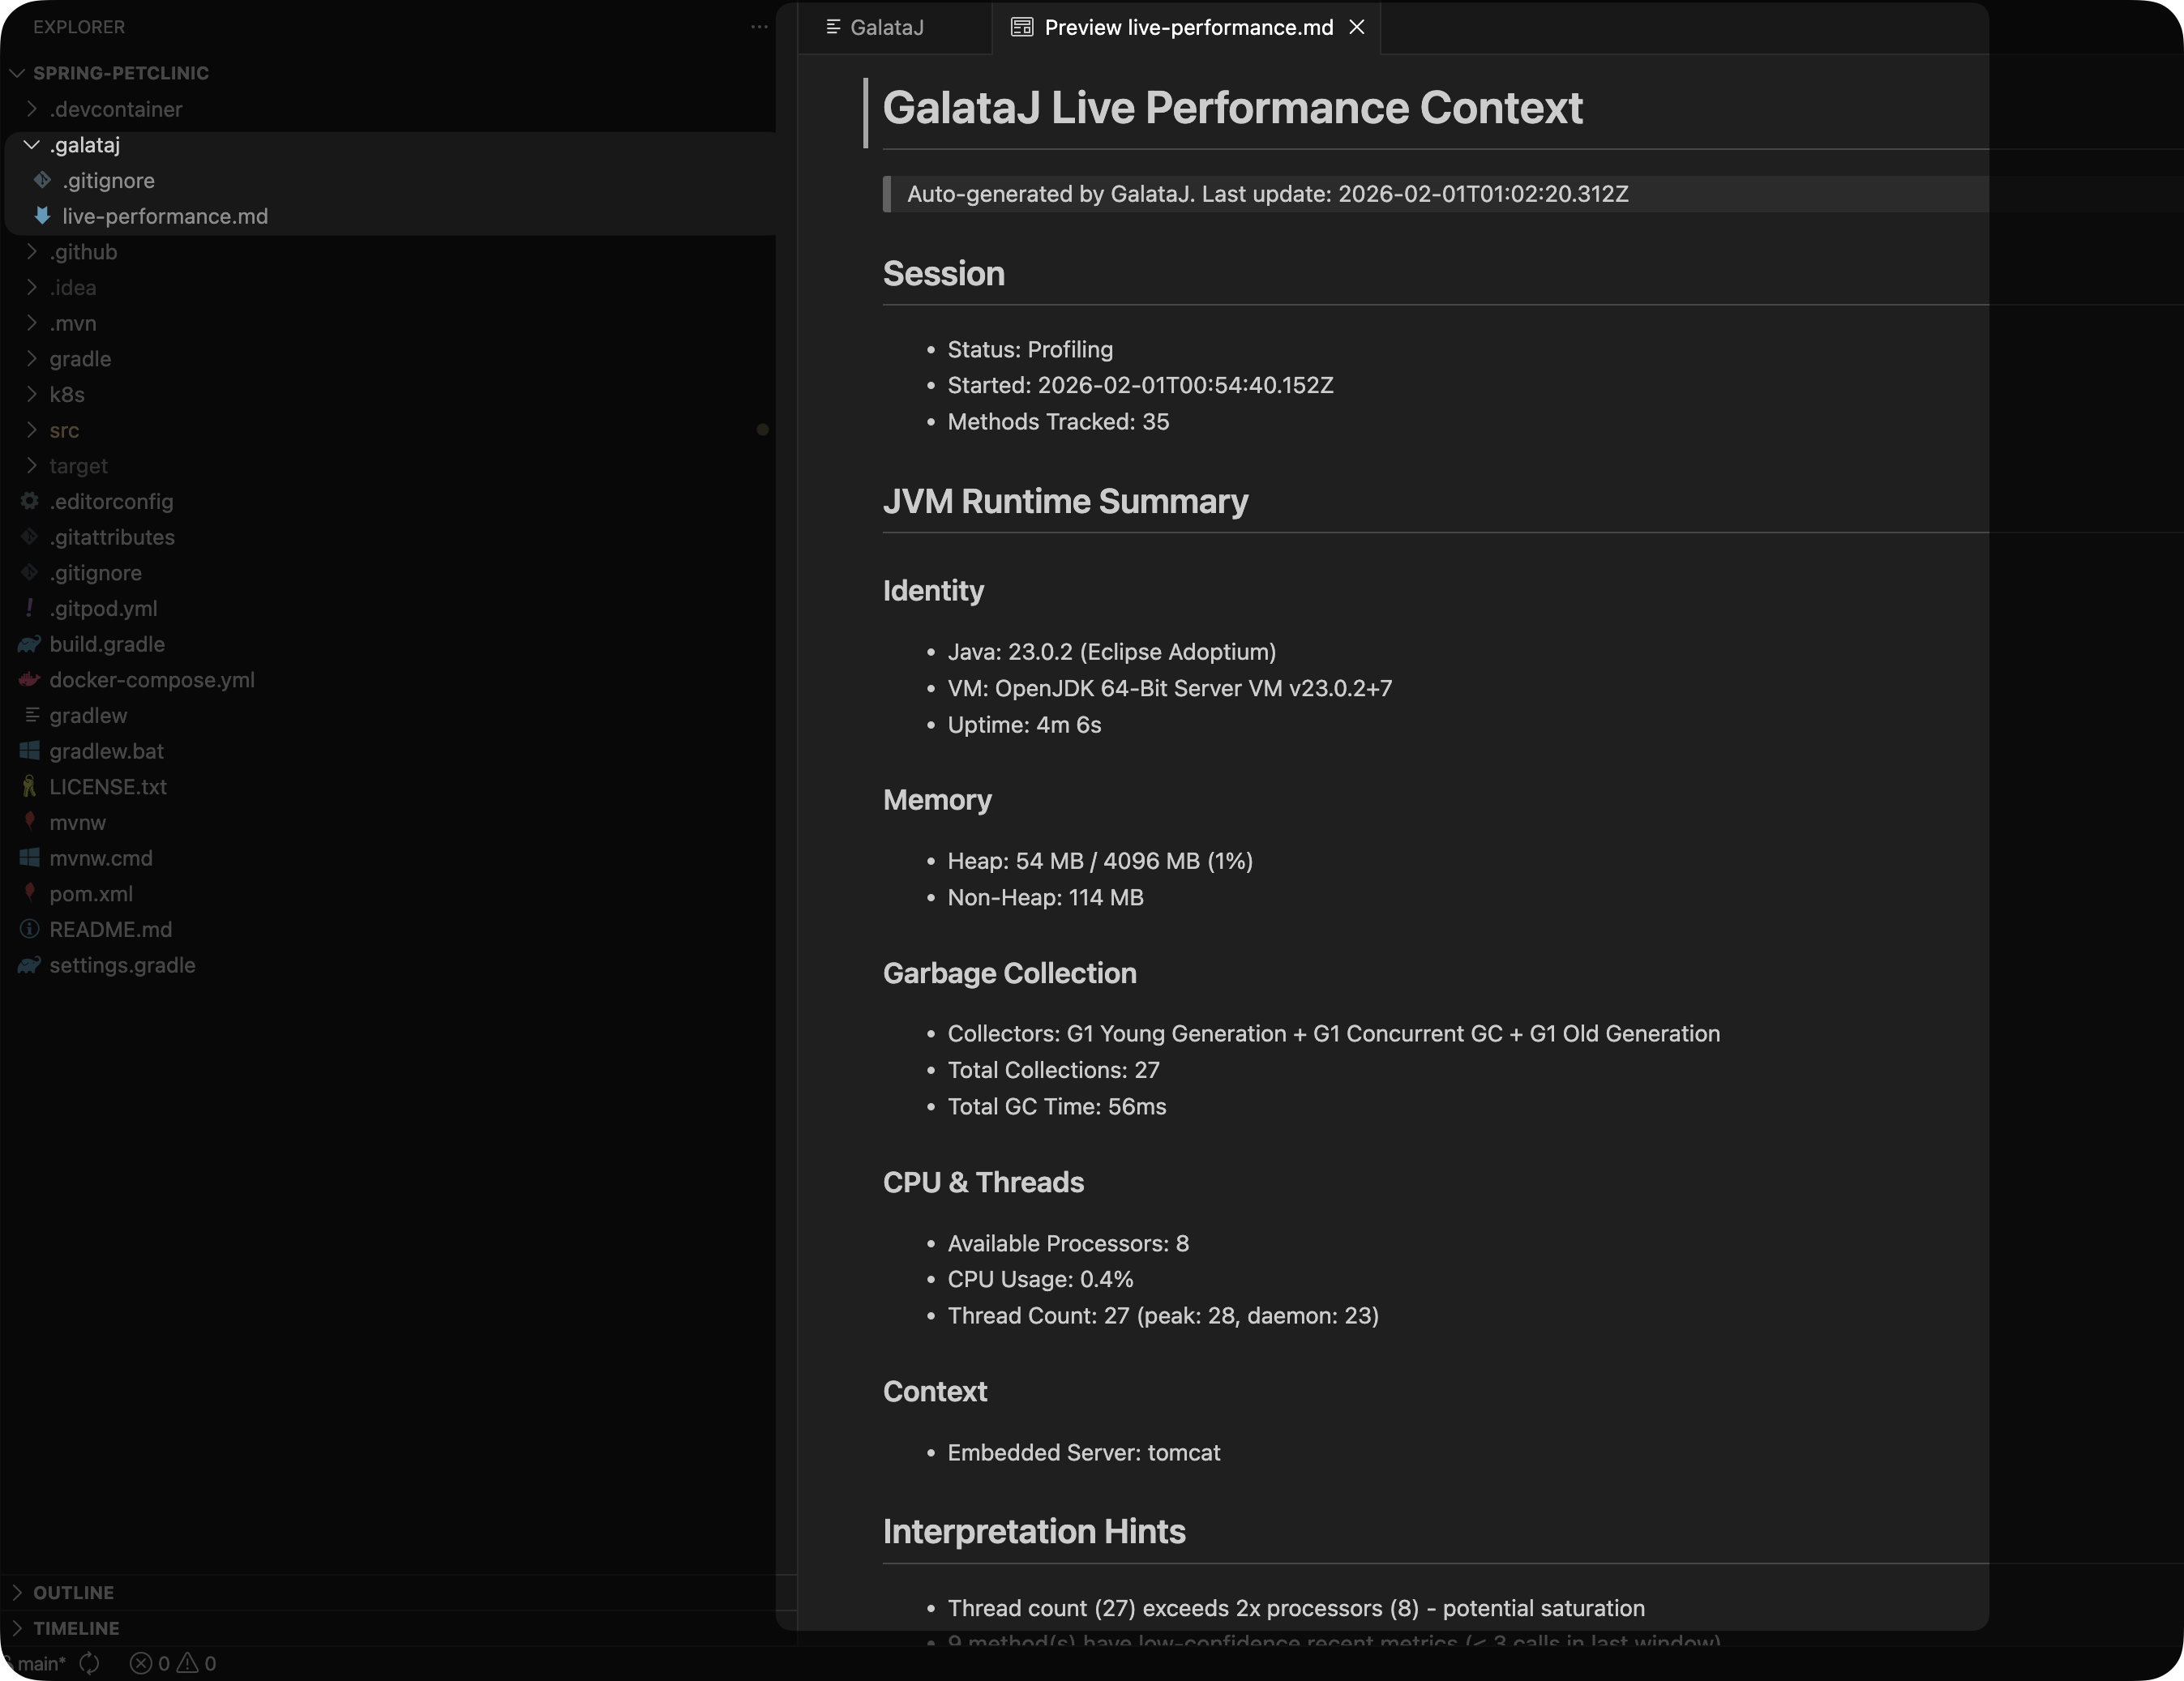
Updates automatically while profiling is active.
Baseline Comparison File
Dział zatytułowany „Baseline Comparison File”baseline-live-compare.md shows how current performance compares to your baseline:
- Methods that got slower (regressions)
- Methods that got faster (improvements)
- Summary statistics
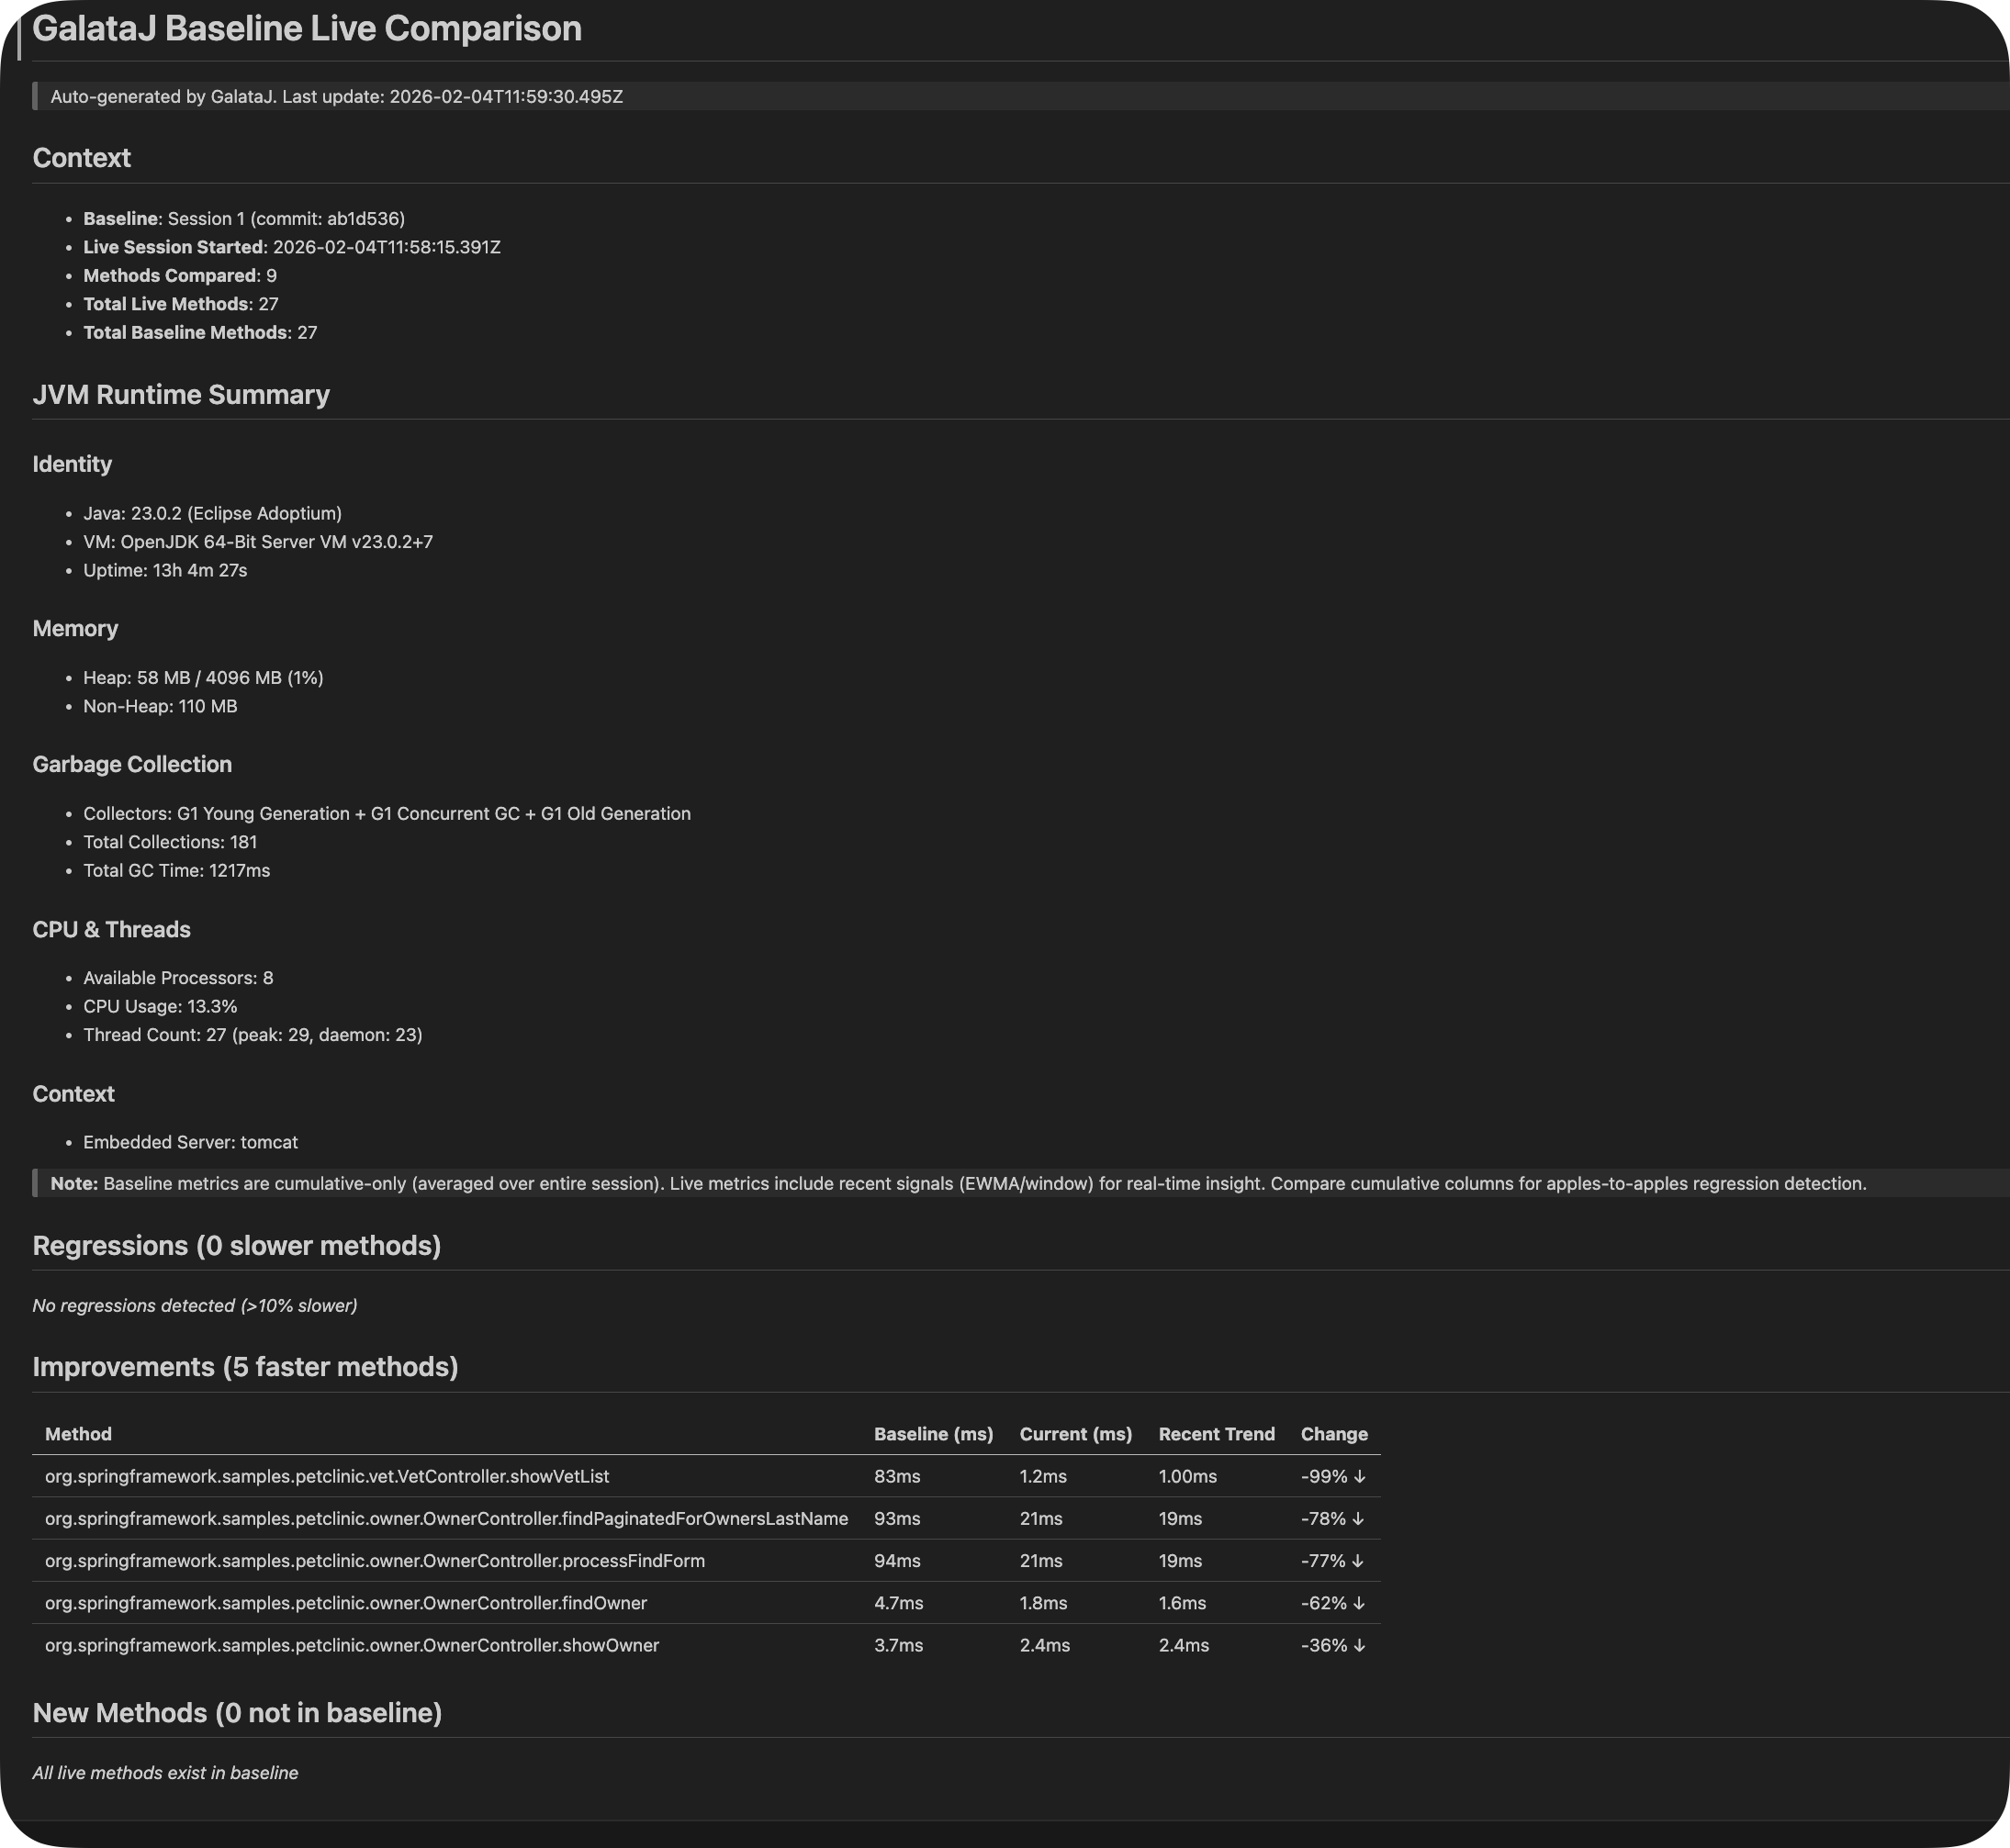
Updates automatically while profiling is active.
Using with AI Assistants
Dział zatytułowany „Using with AI Assistants”Cursor / Windsurf
Dział zatytułowany „Cursor / Windsurf”Reference the file directly:
- “Read @.galataj/live-performance.md and suggest optimizations for the slowest methods”
- “Read the ‘@.galataj/baseline-live-compare.md’ file and see how performance changes after the latest application.”
ChatGPT / Claude
Dział zatytułowany „ChatGPT / Claude”- Copy the content from
.galataj/live-performance.md - Paste into the chat
- Ask your question
Example:
“Here’s my profiling data. Why is OrderService.findAll so slow?”
GitHub Copilot
Dział zatytułowany „GitHub Copilot”“@.galataj/live-performance.md analyze the top 5 slowest methods”
Built-in Prompts
Dział zatytułowany „Built-in Prompts”GalataJ includes ready-made prompts optimized for performance analysis.
Accessing Prompts
Dział zatytułowany „Accessing Prompts”IntelliJ: Profiler panel → Ask AI dropdown
VS Code: GalataJ panel → Ask AI dropdown
Available Prompts
Dział zatytułowany „Available Prompts”Analyze Regressions
Find performance issues and bottlenecks
Suggest Optimizations
Get specific code-level fixes
Memory Analysis
Identify allocation issues and GC pressure
IO vs CPU
Determine if methods are IO-bound or CPU-bound
Custom Prompts
Dział zatytułowany „Custom Prompts”Want your own prompts? You can add custom prompts that appear alongside the built-in ones.
Adding a Custom Prompt
Dział zatytułowany „Adding a Custom Prompt”IntelliJ: Profiler panel → Ask AI → Manage Custom Prompts
VS Code: GalataJ panel → Ask AI → Manage Custom Prompts
Add to Chat
Dział zatytułowany „Add to Chat”Hover any method in the profiler panel → Add to Chat
This copies the method’s metrics directly to your AI conversation.
Tips for Better Results
Dział zatytułowany „Tips for Better Results”Be Specific
Instead of “Why is my app slow?” ask “Why is UserService.findAll taking 200ms when baseline was 20ms?”
Include Context
Mention your tech stack: “This is a Spring Boot 3 app with PostgreSQL”
Verify Suggestions
AI suggestions are starting points. Always profile again after making changes.
Next Steps
Dział zatytułowany „Next Steps”- Session History — Save sessions for AI analysis
- Understanding Metrics — Know what to ask about