Understanding Metrics
GalataJ shows several metrics for each method. Here’s what they mean and how to use them.
Execution Time
Dział zatytułowany „Execution Time”Average (Avg)
Dział zatytułowany „Average (Avg)”The average execution time across all calls since profiling started.
| Value | What it means |
|---|---|
| < 1ms | Fast — typical for simple methods |
| 1-10ms | Normal — acceptable for most code |
| 10-100ms | Worth investigating |
| > 100ms | Slow — likely needs optimization |
Maximum (Max)
Dział zatytułowany „Maximum (Max)”The slowest execution in the recent measurement window.
Why it matters:
- Max >> Avg means you have occasional slow calls (spikes)
- Could indicate timeout issues, GC pauses, or resource contention
- Important for understanding worst-case user experience
Example
If Avg = 5ms but Max = 500ms, something occasionally makes this method very slow. Look for external dependencies, database locks, or GC pressure.
Call Count
Dział zatytułowany „Call Count”The total number of times the method was called since profiling started.
| Pattern | What to look for |
|---|---|
| Very high calls + low time | Could be N+1 query problem |
| High calls + high time | Major performance impact |
| Low calls + high time | Individual calls are slow |
N+1 Query Detection
If UserRepository.findById shows 1000 calls but UserService.getAll shows only 1 call, you likely have an N+1 query loading users one by one.
Shows how performance is changing over time.
| Indicator | Meaning |
|---|---|
| ↑ (up arrow) | Getting slower — investigate! |
| ↓ (down arrow) | Getting faster — good news |
| — (no change) | Stable performance |
Color coding:
- 🔴 Red trend = Performance regression
- 🟢 Green trend = Performance improvement
- ⚪ Gray = No significant change
What Causes Trends?
Dział zatytułowany „What Causes Trends?”Getting slower (↑):
- Data volume growing
- Memory pressure / GC
- External service slowdown
- Code changes
Getting faster (↓):
- Caching taking effect
- JIT optimization warming up
- Load decreasing
Memory Allocations
Dział zatytułowany „Memory Allocations”Shows bytes allocated per call (when available).
| Value | What it means |
|---|---|
| < 1 KB | Minimal allocation |
| 1-10 KB | Normal for most operations |
| 10-100 KB | Consider optimization |
| > 100 KB | High allocation — may cause GC pressure |
Why It Matters
High allocations lead to more garbage collection, which causes pauses and impacts overall performance.
Reading Inline Hints
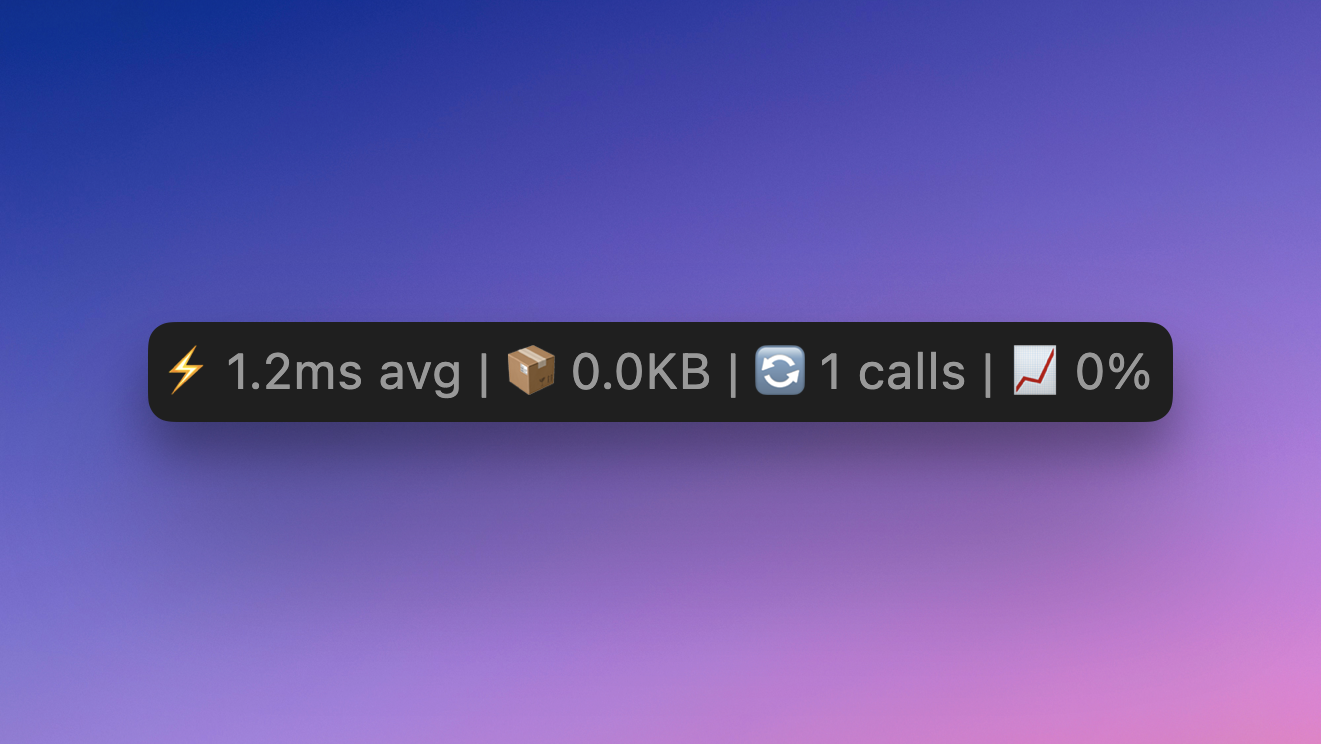
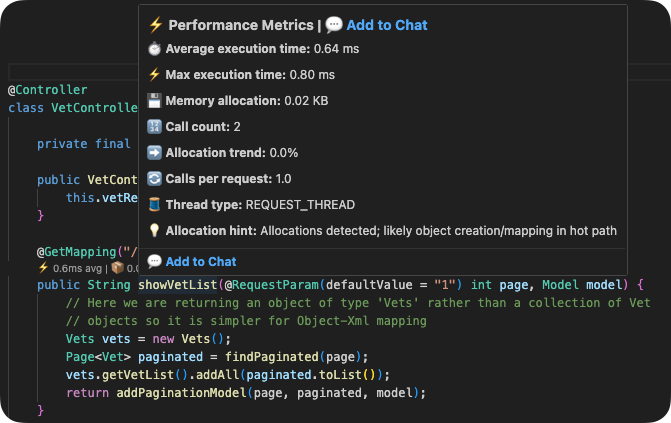
Dział zatytułowany „Reading Inline Hints”The inline hints above your methods show a condensed view:
avg 45ms | max 120ms | 1,234 calls | ↑ 15%Hover over the hint for the full breakdown.
Quick Reference
Dział zatytułowany „Quick Reference”Find Slowest Methods
Sort by Avg descending
Find N+1 Queries
Sort by Calls descending, look for unexpectedly high counts
Find Regressions
Sort by Trend, look for ↑ arrows
Find Memory Issues
Check Alloc column for high values
Next Steps
Dział zatytułowany „Next Steps”- Profiler Panel Guide — Navigate the panel efficiently
- Session History — Compare performance over time