Features
GalataJ brings performance insights directly into your development workflow.
Inline Performance Hints
Section titled “Inline Performance Hints”See metrics directly above your methods — no need to switch windows or tools.
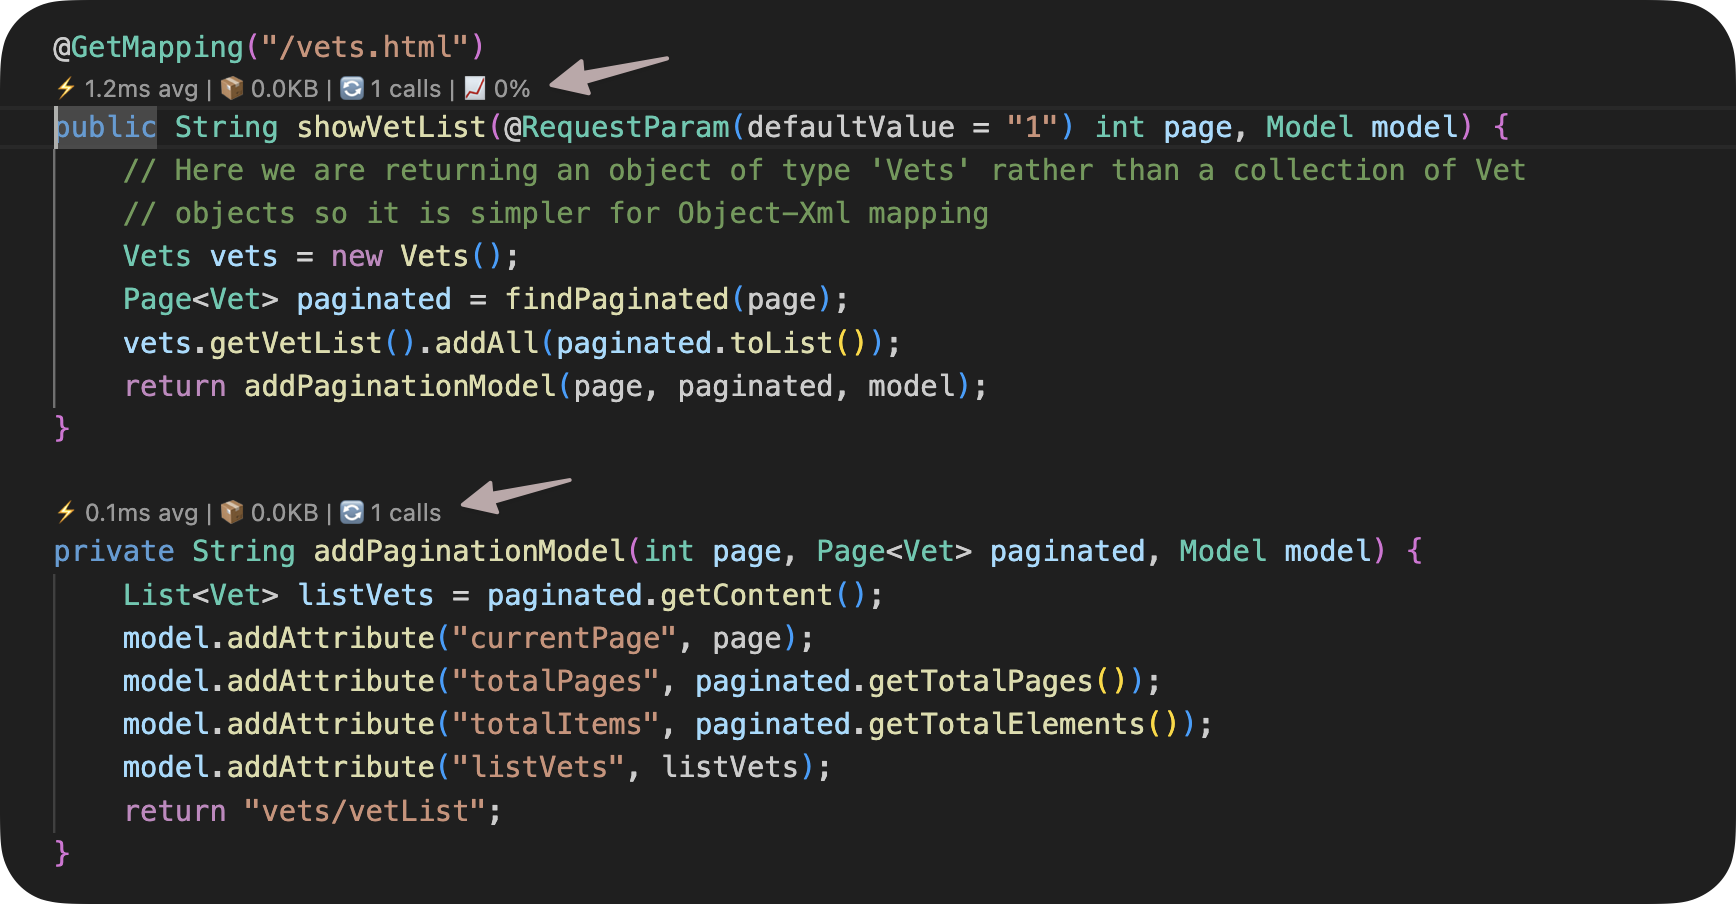
What you see:
- Avg time — Average execution time across all calls
- Max time — Slowest execution in recent window
- Calls — Total number of invocations
- Trend — Performance change indicator (↑ slower, ↓ faster)
Hover over any hint for more details.
Profiler Panel
Section titled “Profiler Panel”A dedicated panel showing all profiled methods in one place.
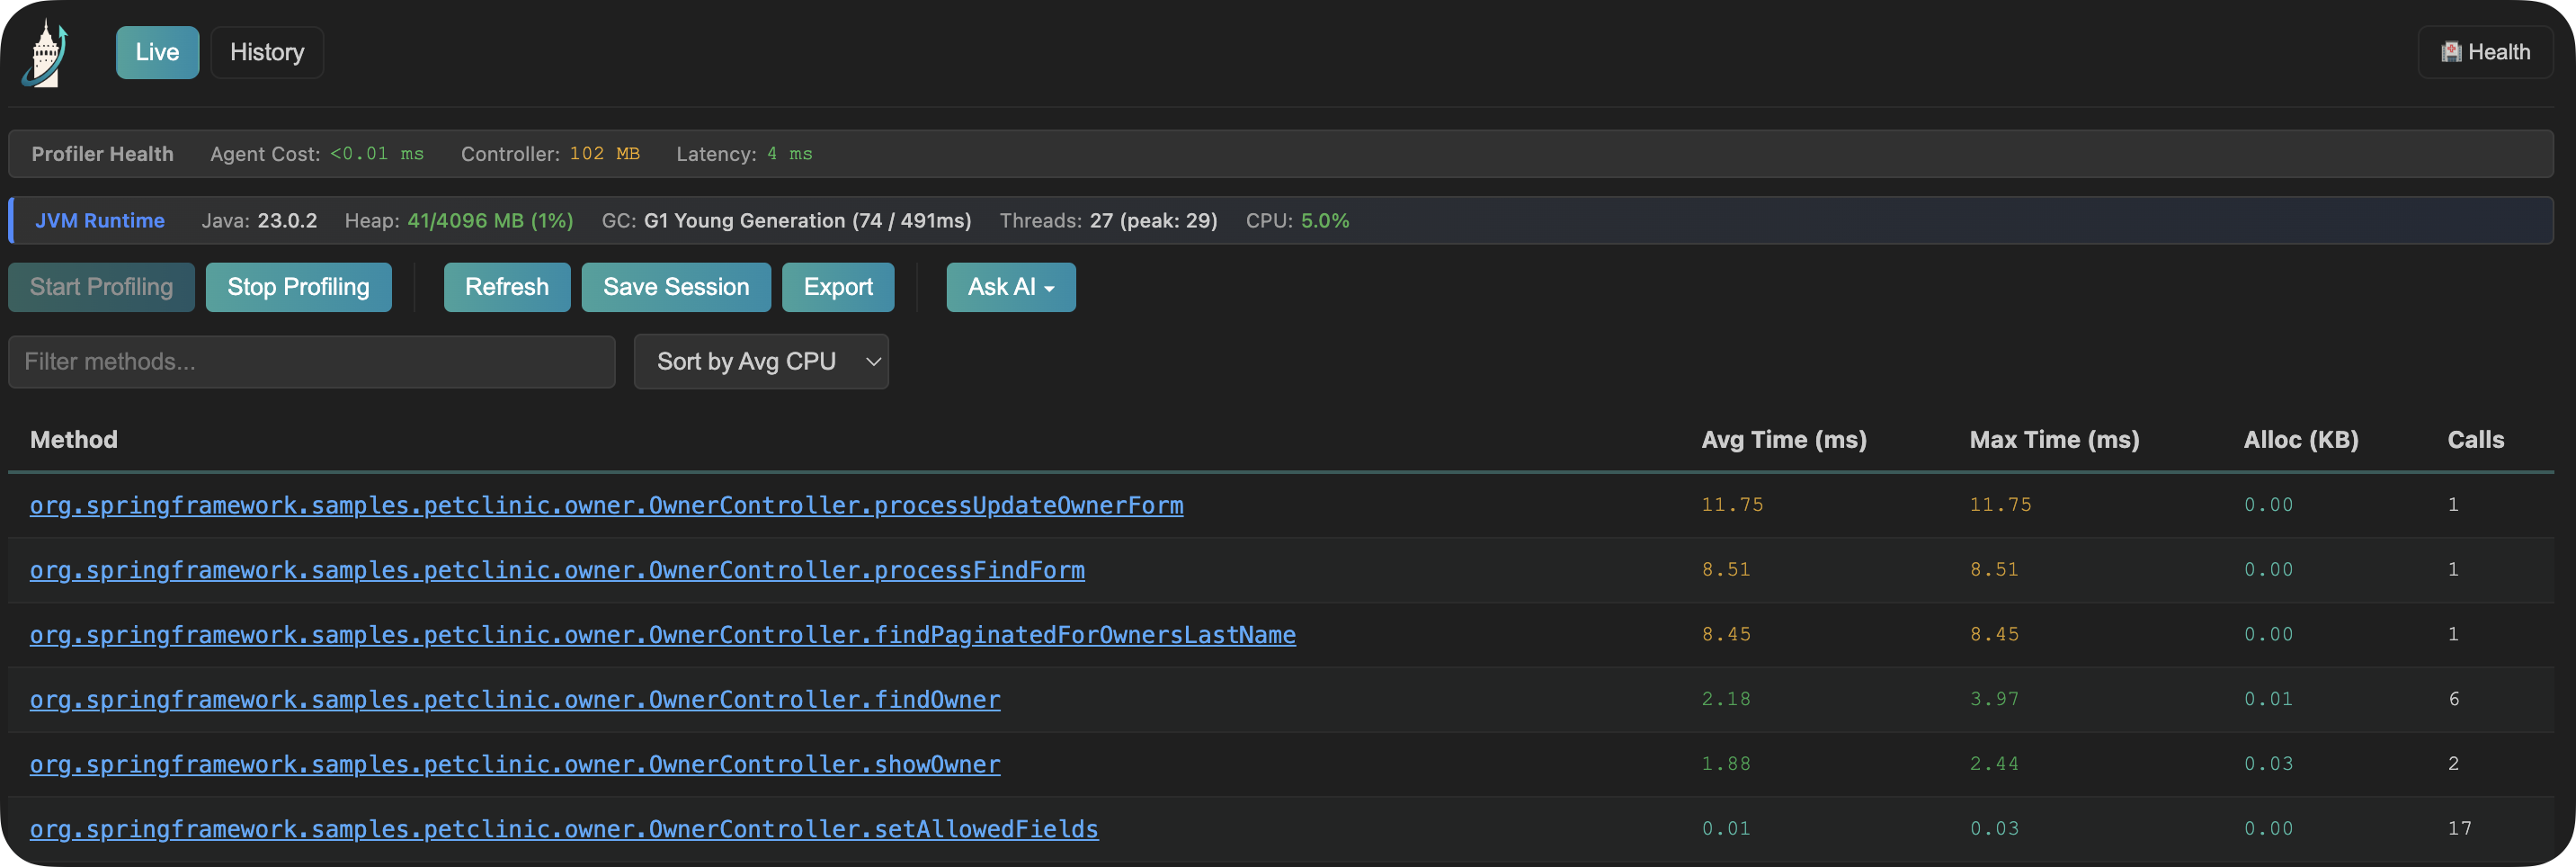
Panel features:
- Sort by any column (time, calls, trend)
- Filter by package or class name
- Click any method to jump to source
- Real-time updates while profiling
AI Integration
Section titled “AI Integration”Pro Feature
AI context files require a Pro license.
Get AI-powered insights from your profiling data.
How it works:
- GalataJ generates
live-performance.mdin your project - Point your AI assistant (ChatGPT, Claude, Cursor) to this file
- Ask questions like “Why is OrderService slow?”
- Get specific optimization suggestions
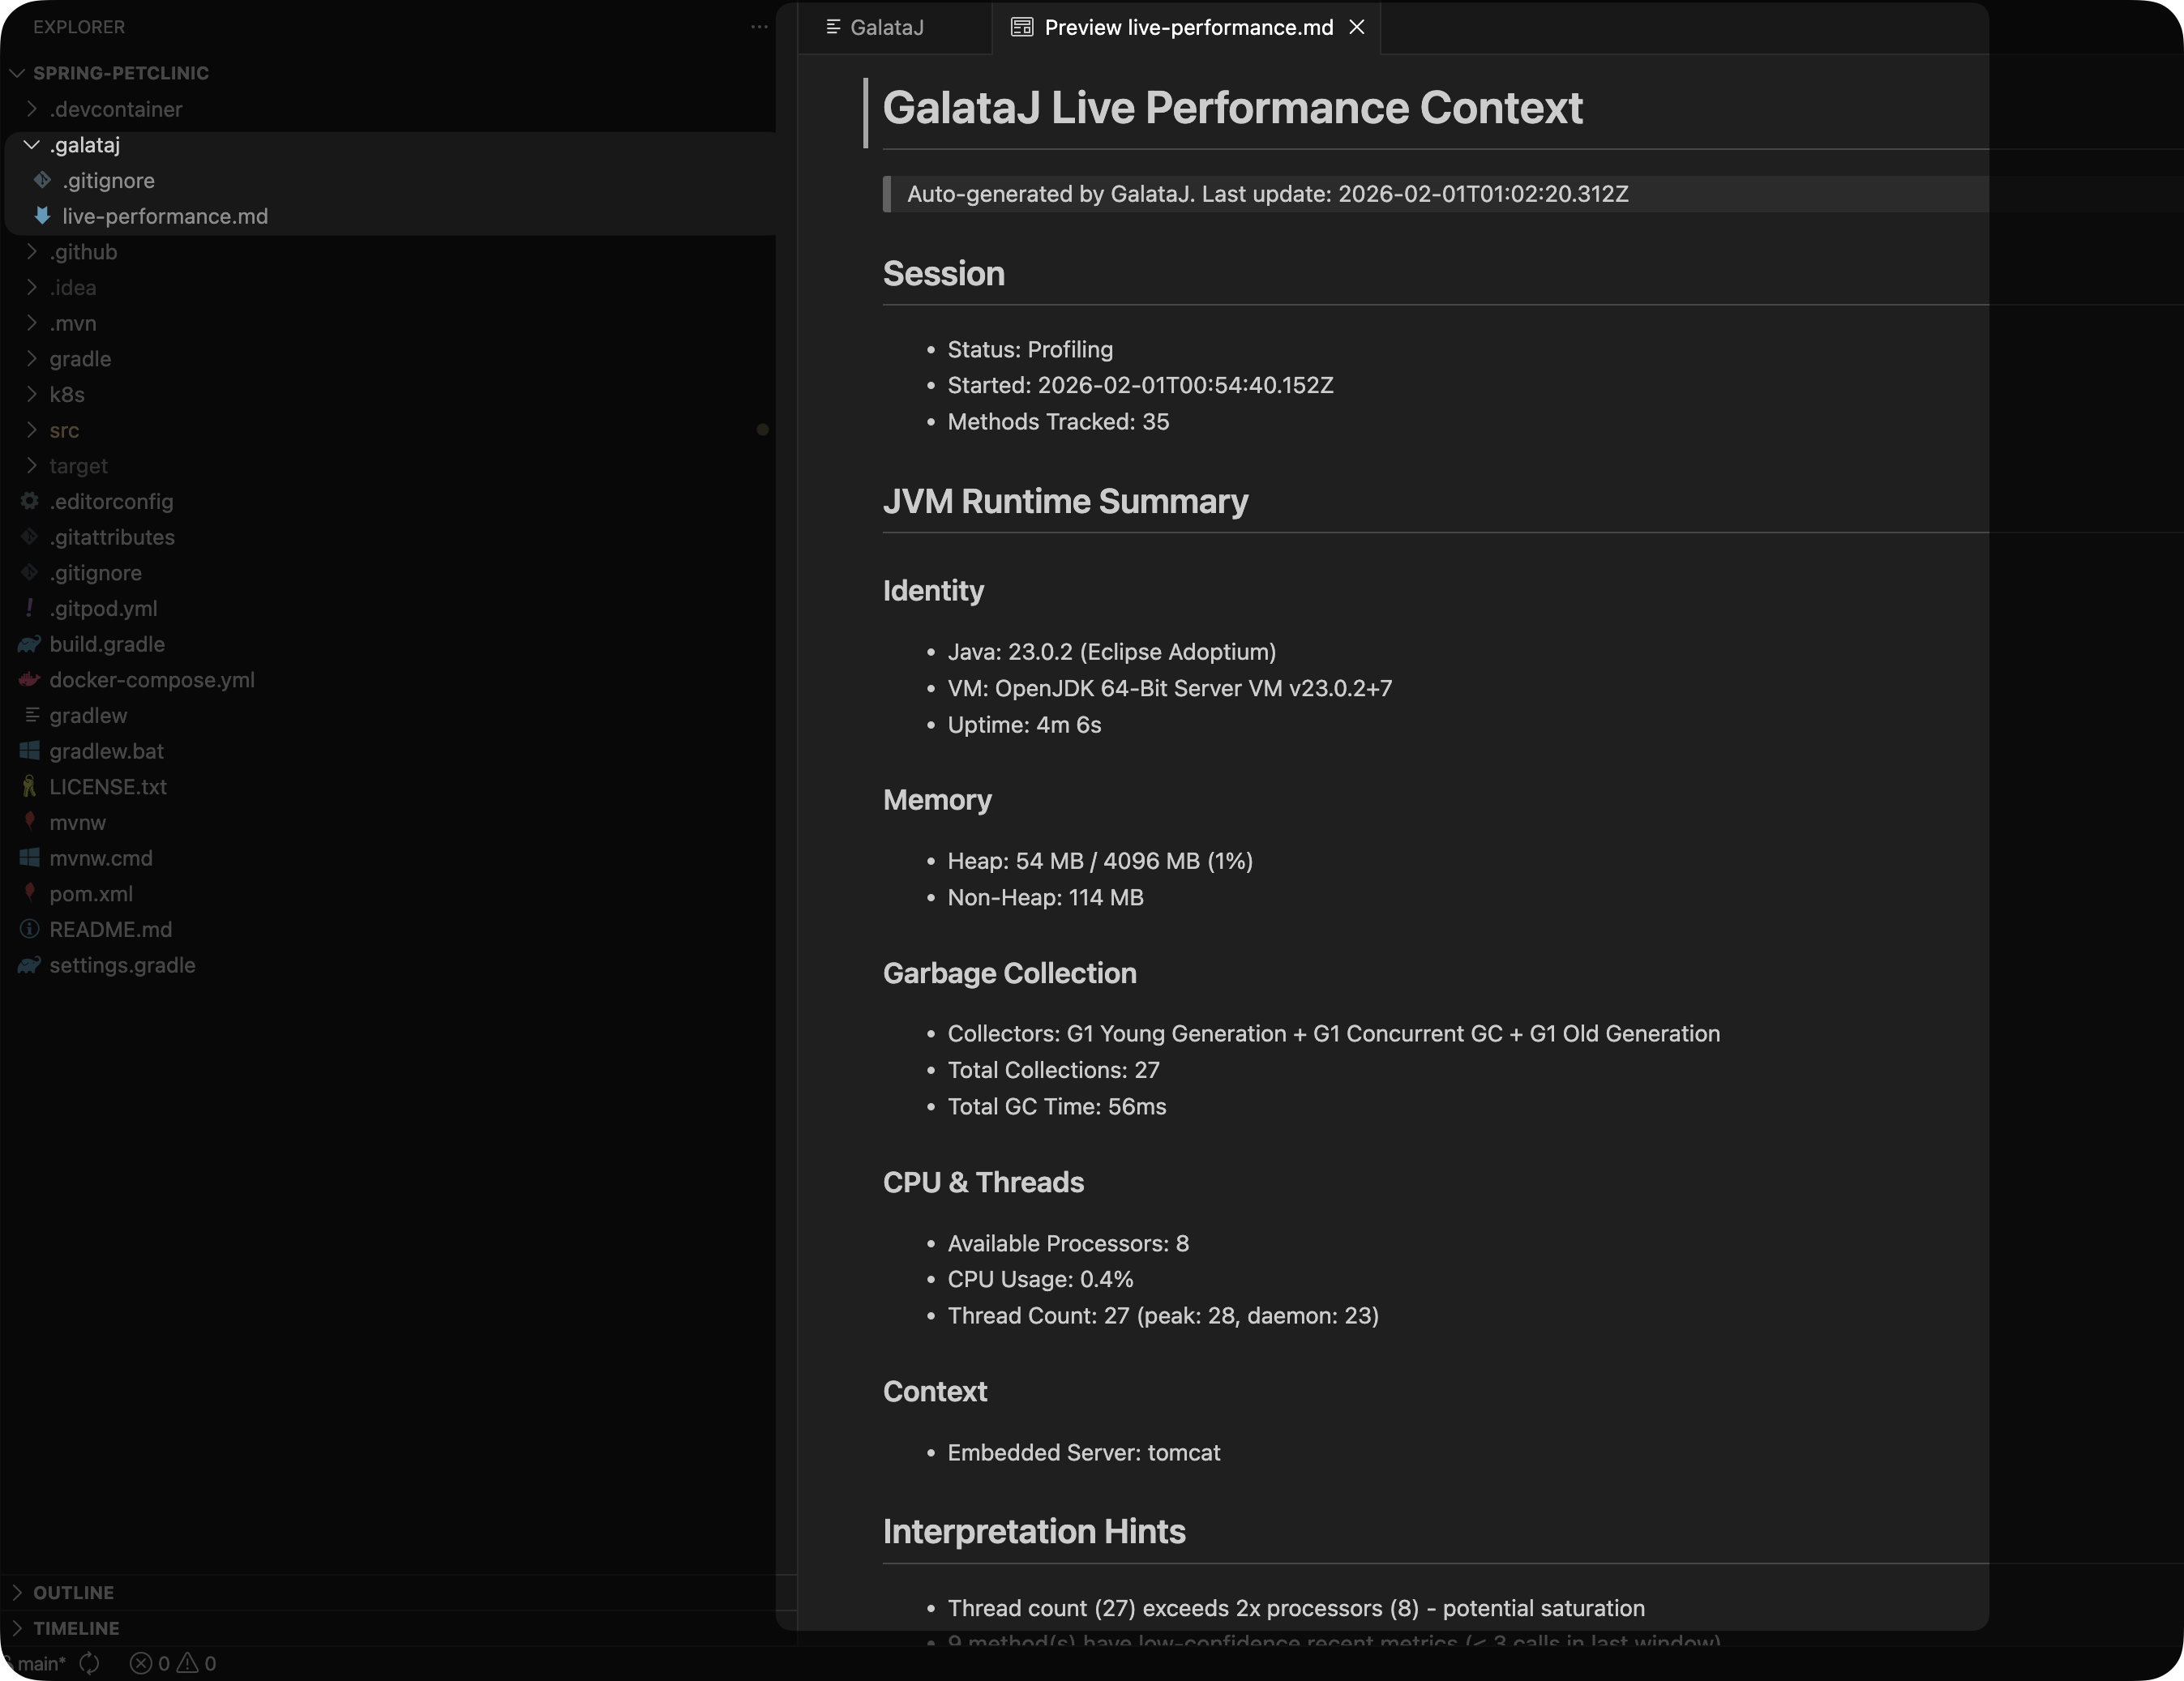
Built-in prompts:
- Analyze performance regressions
- Suggest concrete optimizations
- GC & memory analysis
- IO vs CPU diagnosis
Custom prompts: Create your own prompts for your specific use cases (N+1 detection, framework-specific analysis, etc.)
Learn more about AI Integration →
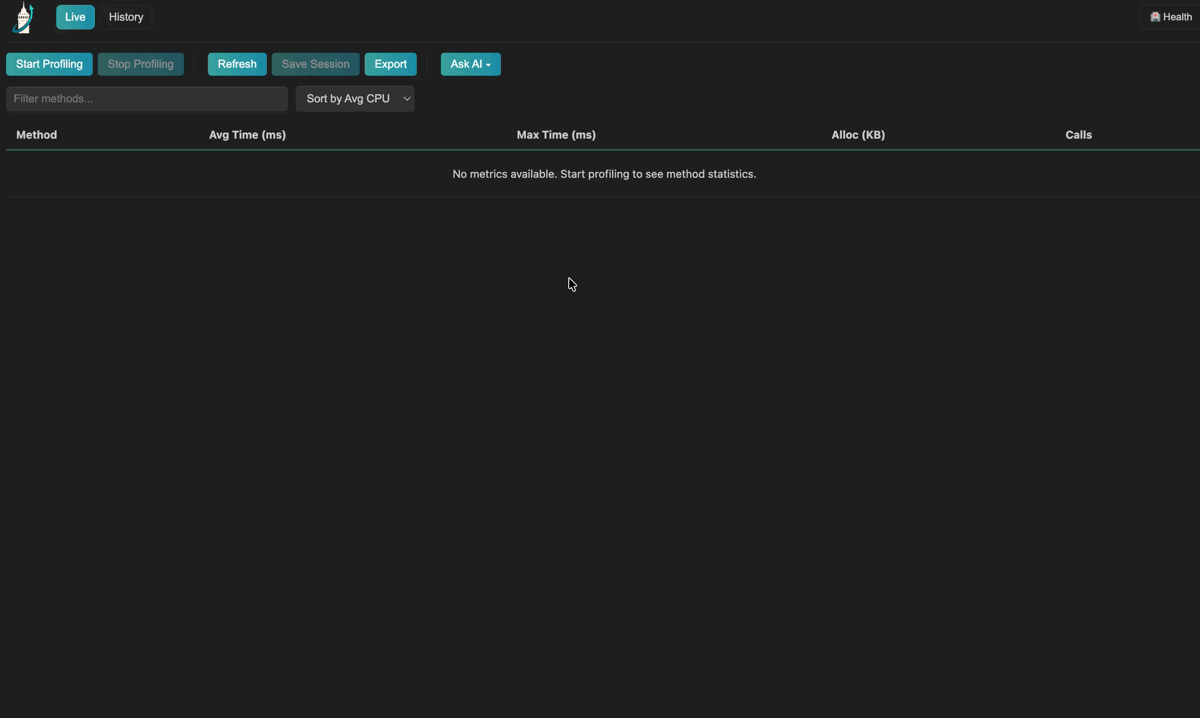
Local & Docker Profiling
Section titled “Local & Docker Profiling”Profile Java applications running locally or inside Docker containers.
Local JVMs
Profile any Java application running on your machine. GalataJ auto-discovers running JVMs.
Free
Context Detection
Section titled “Context Detection”GalataJ automatically detects what your code is doing:
HTTP Endpoints
REST controllers show endpoint paths
Database Queries
Repository methods show query patterns
Scheduled Tasks
@Scheduled methods show schedule info
Async Methods
@Async methods show thread context
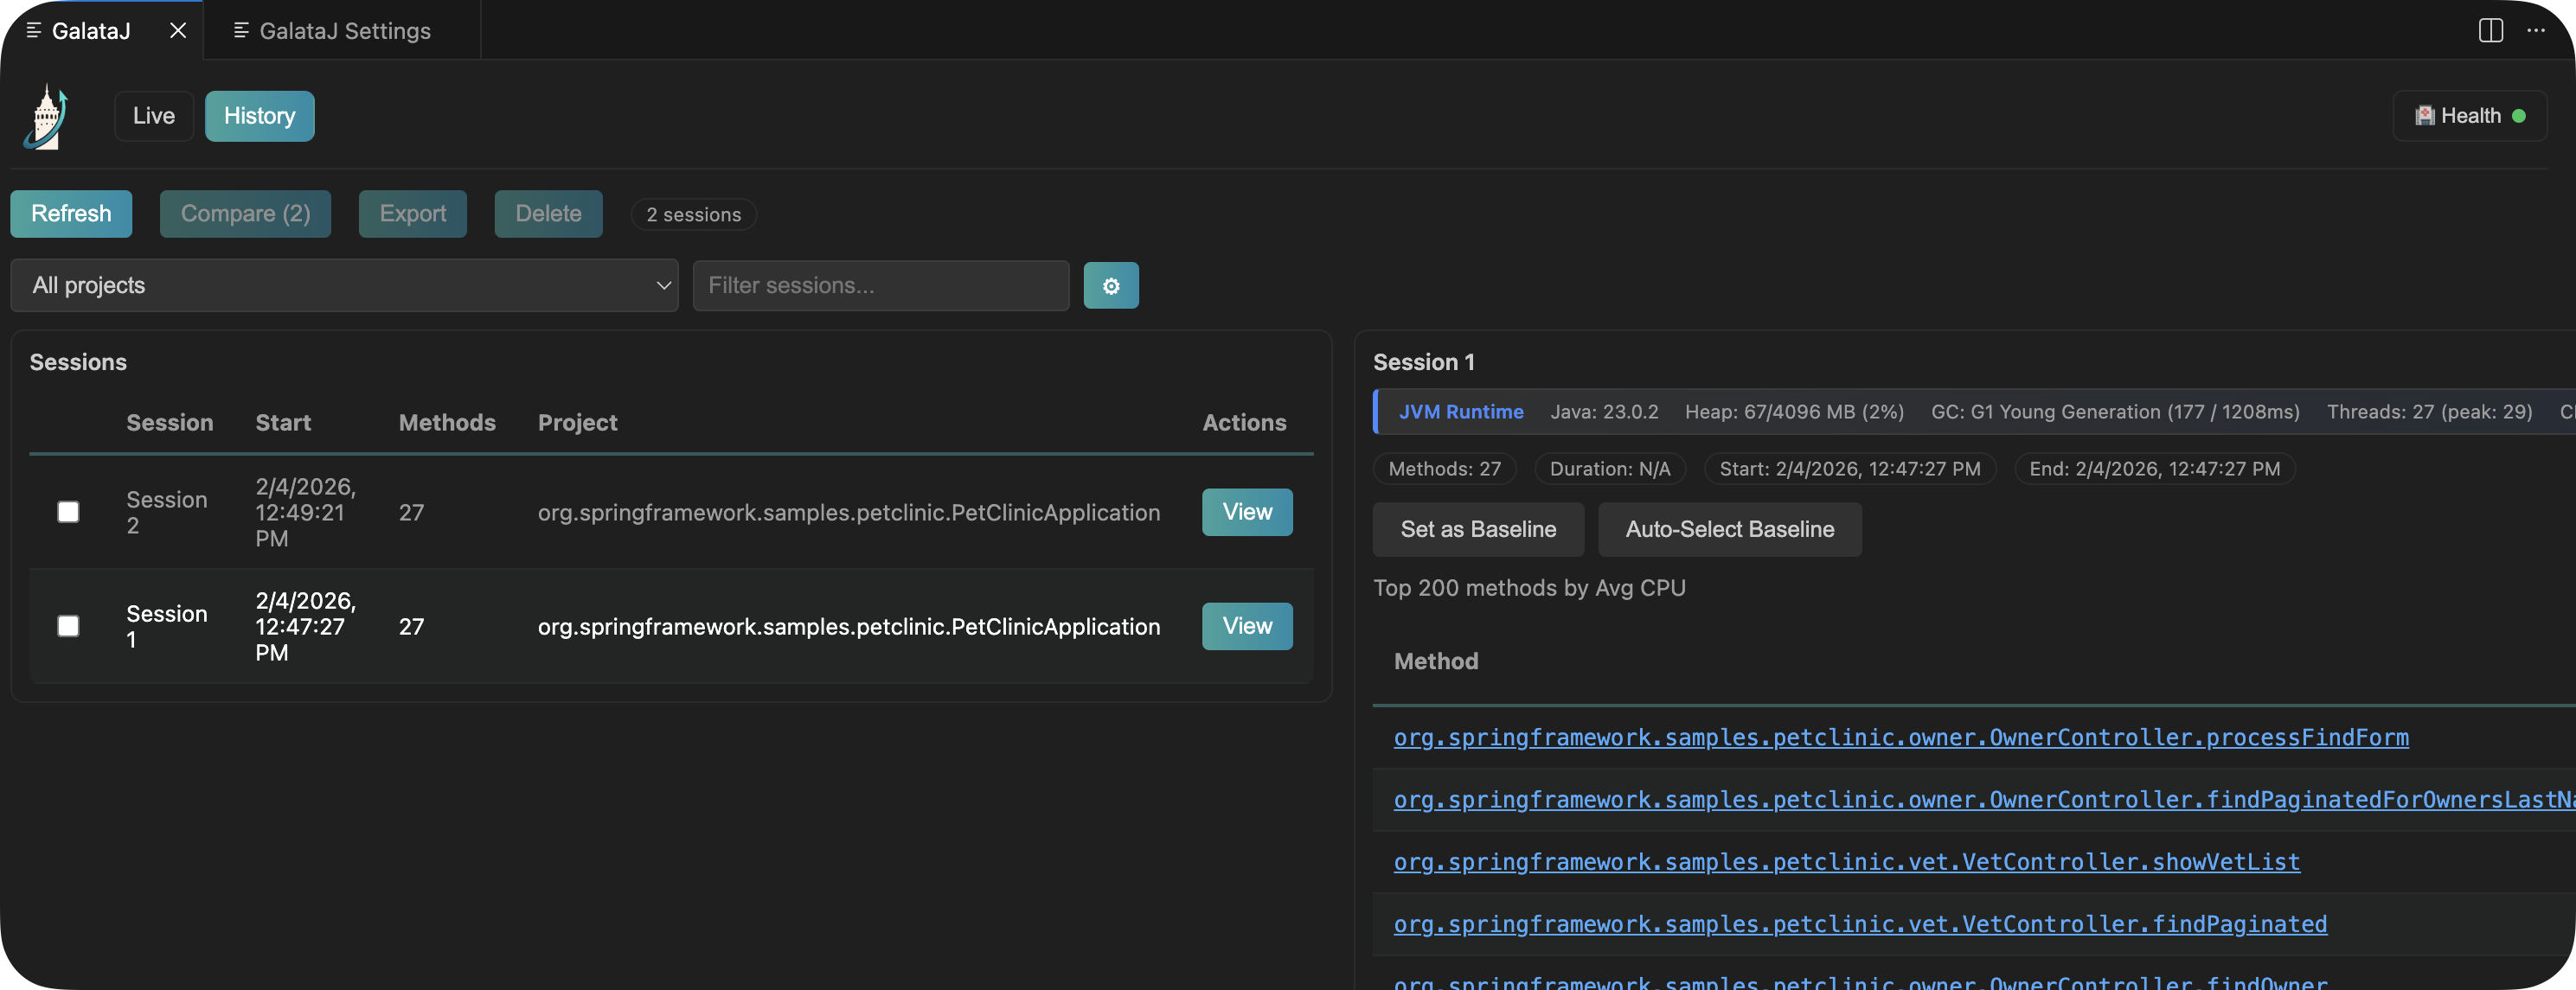
Session History
Section titled “Session History”Pro Feature
Session management features require a Pro license.
Save profiling sessions to compare performance over time.
What you can do:
- Save sessions — Capture current metrics with a name
- Set baselines — Mark a session as your reference point
- Compare any two sessions — Select two sessions and see exactly what changed
- Export sessions — Download as JSON, CSV, or HTML
- Export comparisons — Download comparison results as Markdown for AI analysis
System Health
Section titled “System Health”One-click health check ensures everything is working.
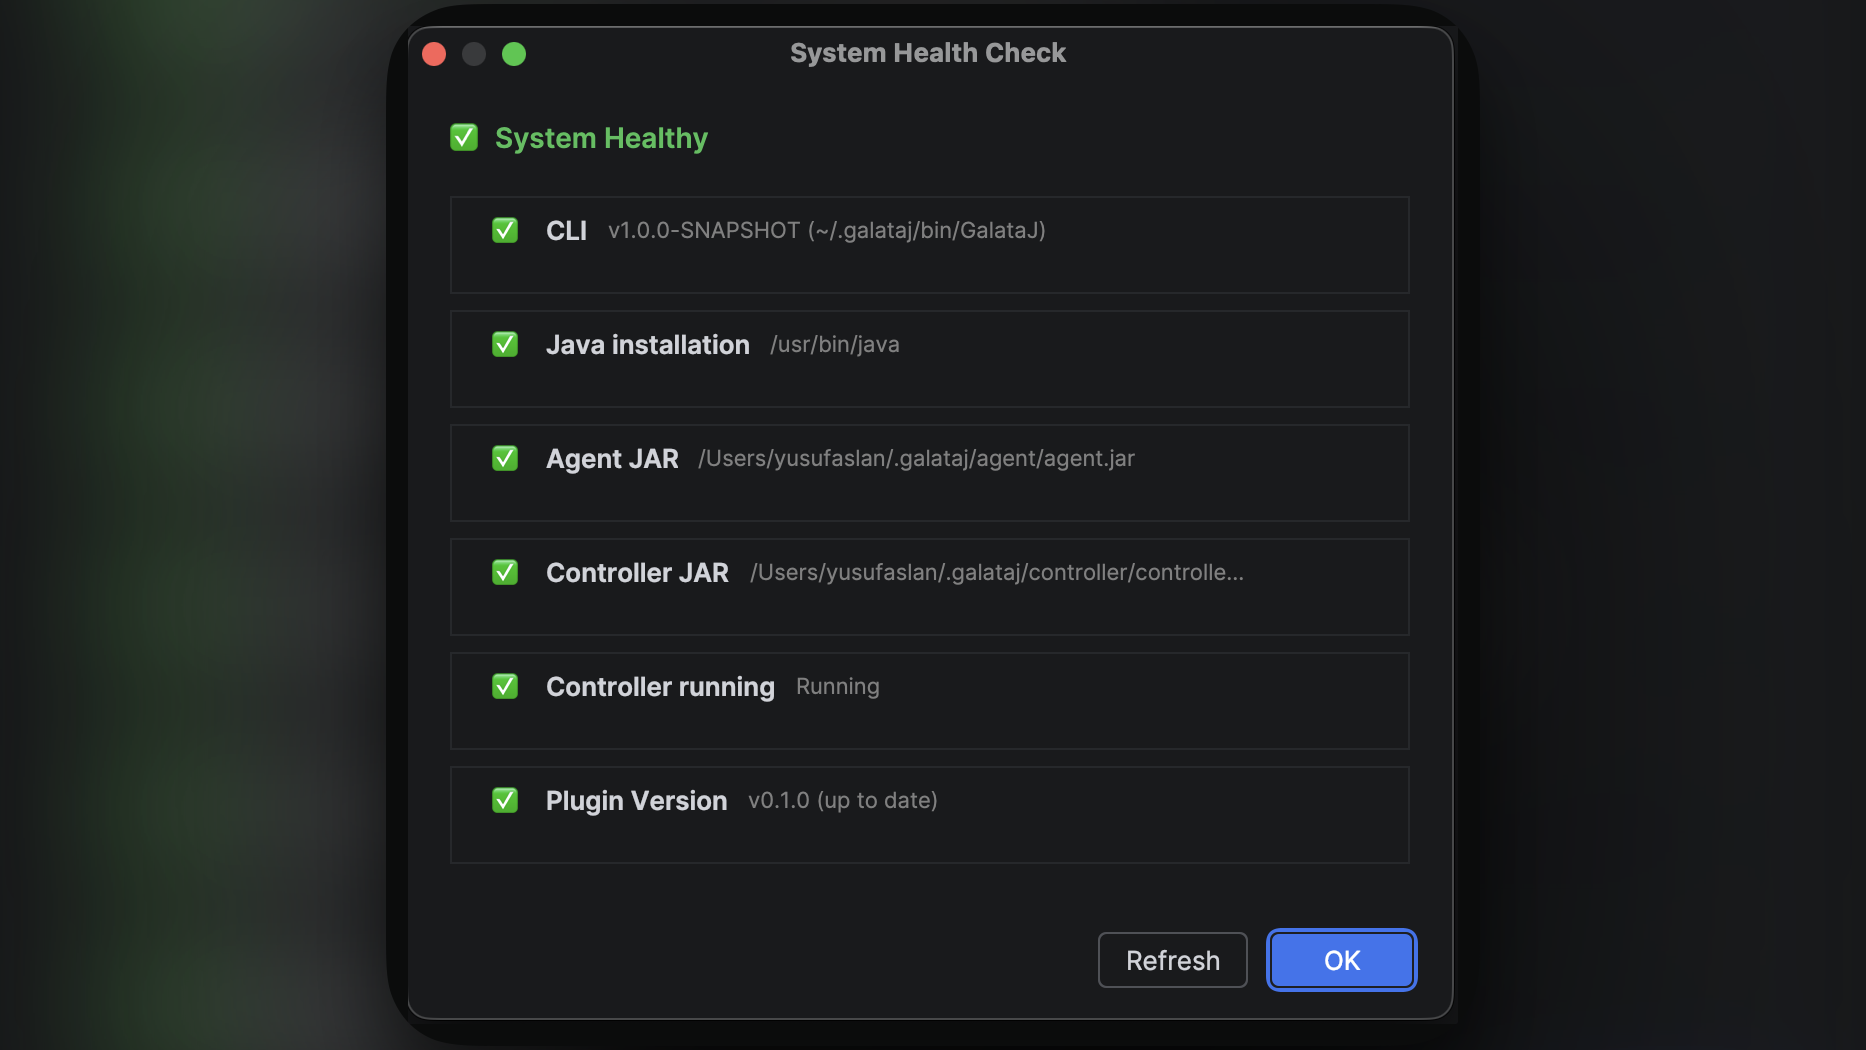
Checks:
- Plugin components installed
- Controller running
- Java available
- Updates available
If something’s wrong, click the Fix button — GalataJ handles it automatically.
IDE Support
Section titled “IDE Support”IntelliJ IDEA
2024.1 or later
CodeVision integration, tool windows, Run menu actions
VS Code
1.80 or later
Also works with Cursor and Windsurf