VS Code / Cursor / Windsurf
See performance metrics directly in your VS Code-based editor.
Works with all VS Code-based editors
This guide applies to VS Code, Cursor, and Windsurf — they all use the same extension.
Installation
Section titled “Installation”- Open Extensions (Ctrl+Shift+X)
- Search for “GalataJ”
- Click Install
No restart needed!
Requirements
VS Code 1.80 or later
Start Profiling
Section titled “Start Profiling”- Run your Java application
- Open Command Palette (Ctrl+Shift+P)
- Run “GalataJ: Start Profiling”
- Select your JVM from the list
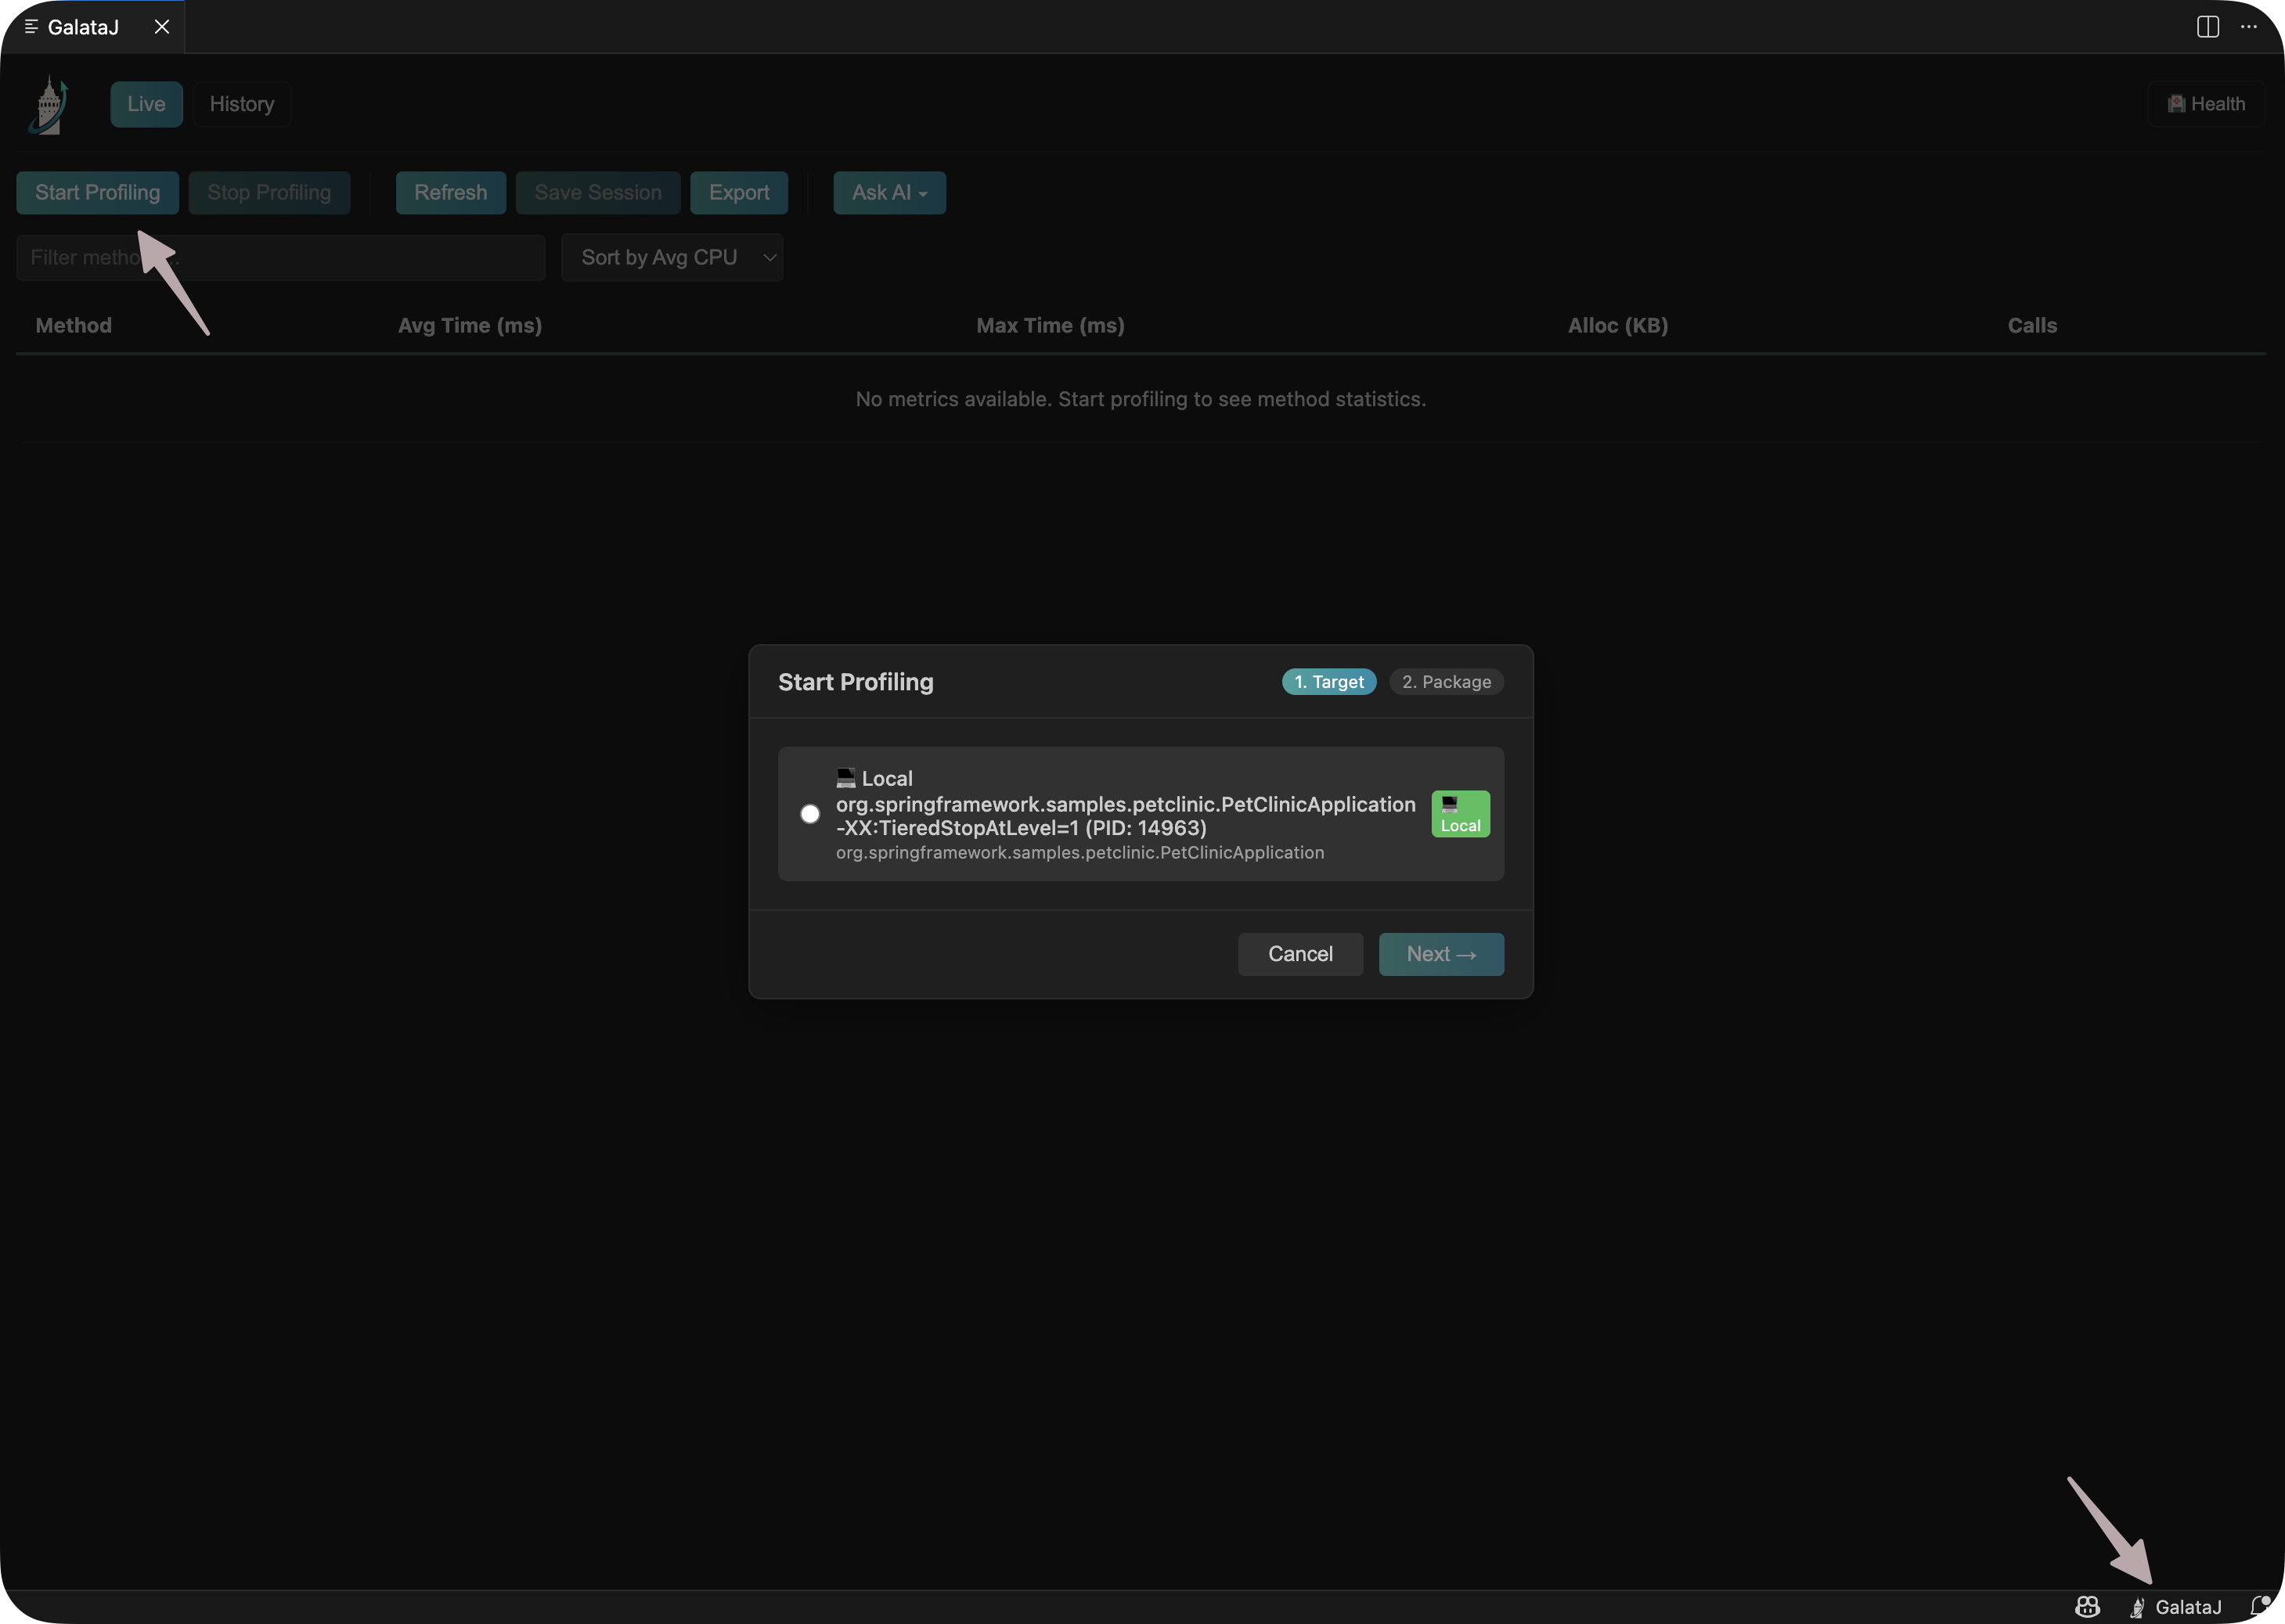
That’s it! Metrics will appear above your methods.
Inline Hints
Section titled “Inline Hints”Performance data appears directly above your methods:
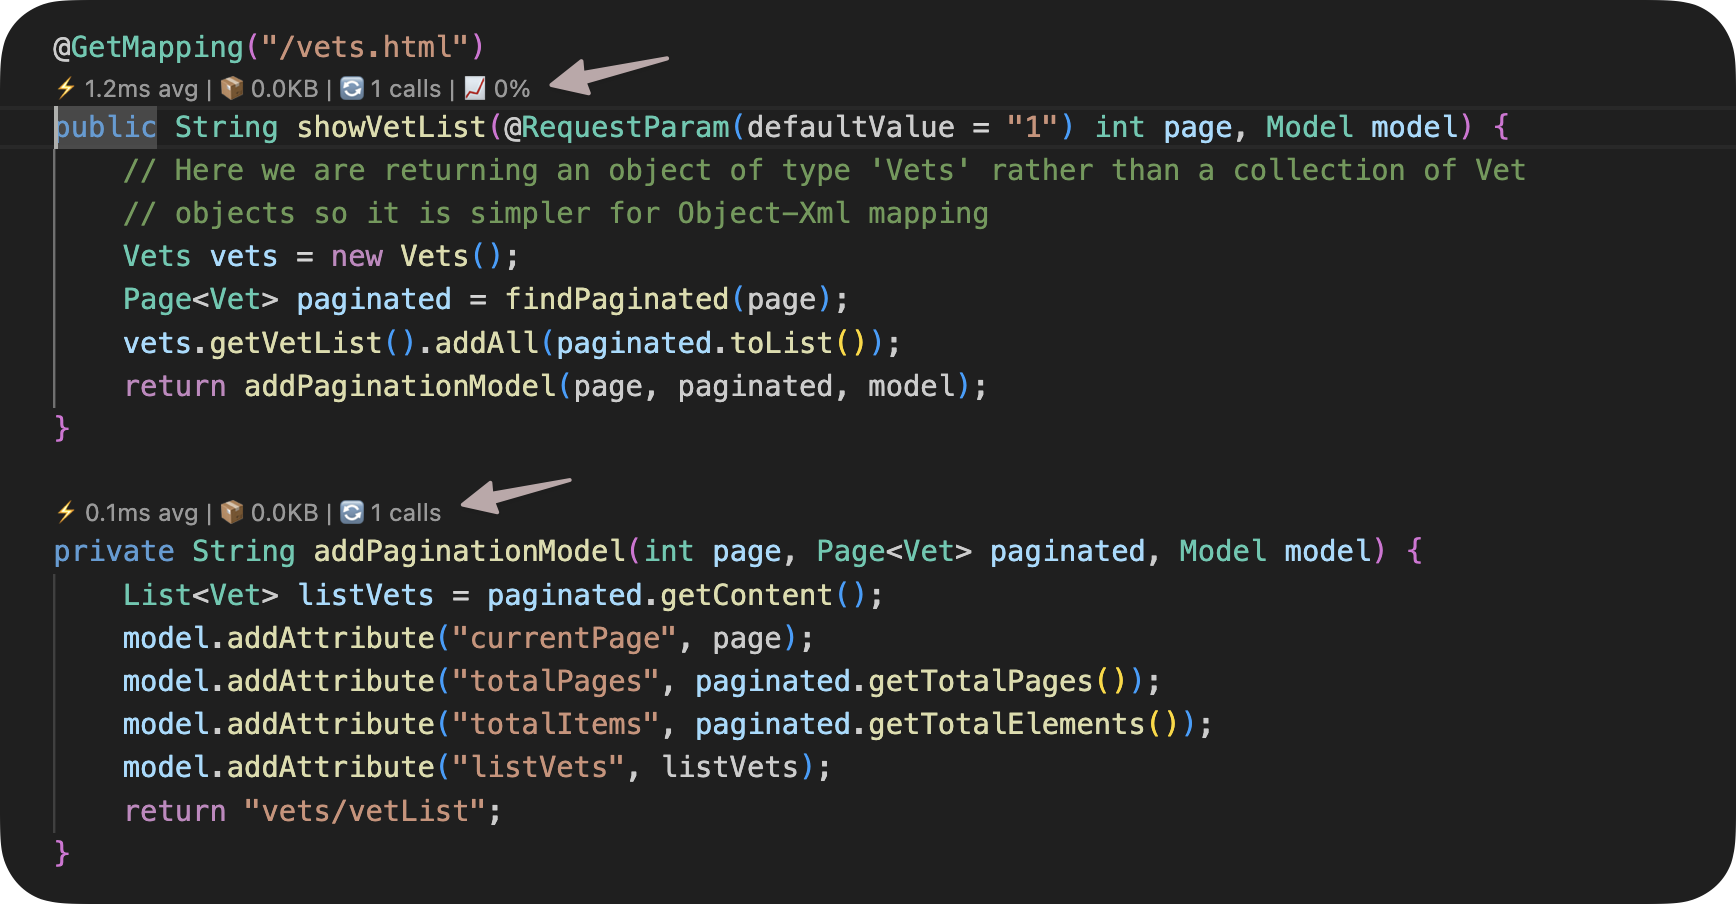
Metrics shown:
- Avg — Average execution time
- Max — Maximum execution time
- Calls — Number of invocations
- Trend — Performance change (↑ slower, ↓ faster)
Hover over a hint for more details.
Stop Profiling
Section titled “Stop Profiling”Open Command Palette (Ctrl+Shift+P) and run “GalataJ: Stop Profiling”
Settings
Section titled “Settings”Open Settings and search for “GalataJ” to customize:
- Show/hide inline hints
- Auto-start controller
- Update interval
Troubleshooting
Section titled “Troubleshooting”JVM not appearing
Section titled “JVM not appearing”Run “GalataJ: Refresh JVMs” from Command Palette. Make sure your Java app is running.
No metrics showing
Section titled “No metrics showing”- Check status bar shows “GalataJ: Connected”
- Open files from the profiled package
- Wait a few seconds for data to arrive
Extension not activating
Section titled “Extension not activating”Reload the window: Command Palette → “Developer: Reload Window”
Need more help?
Section titled “Need more help?”Run “GalataJ: Health Check” from Command Palette.