Quickstart
Get performance metrics in your code editor in just a few clicks.
No terminal needed
Everything happens in your IDE. Just click and see your metrics.
Step 1: Install the Plugin
Section titled “Step 1: Install the Plugin”IntelliJ IDEA
Section titled “IntelliJ IDEA”- Open Settings → Plugins → Marketplace
- Search “GalataJ”
- Click Install → Restart IDE
VS Code / Cursor / Windsurf
Section titled “VS Code / Cursor / Windsurf”- Open Extensions (Ctrl+Shift+X)
- Search “GalataJ”
- Click Install
Step 2: Run Your Java App
Section titled “Step 2: Run Your Java App”Start your Java application normally — however you usually run it.
Step 3: Start Profiling
Section titled “Step 3: Start Profiling”IntelliJ IDEA
Section titled “IntelliJ IDEA”Go to Run → Start GalataJ Profiling
VS Code / Cursor / Windsurf
Section titled “VS Code / Cursor / Windsurf”Open Command Palette (Ctrl+Shift+P) and run “GalataJ: Start Profiling”
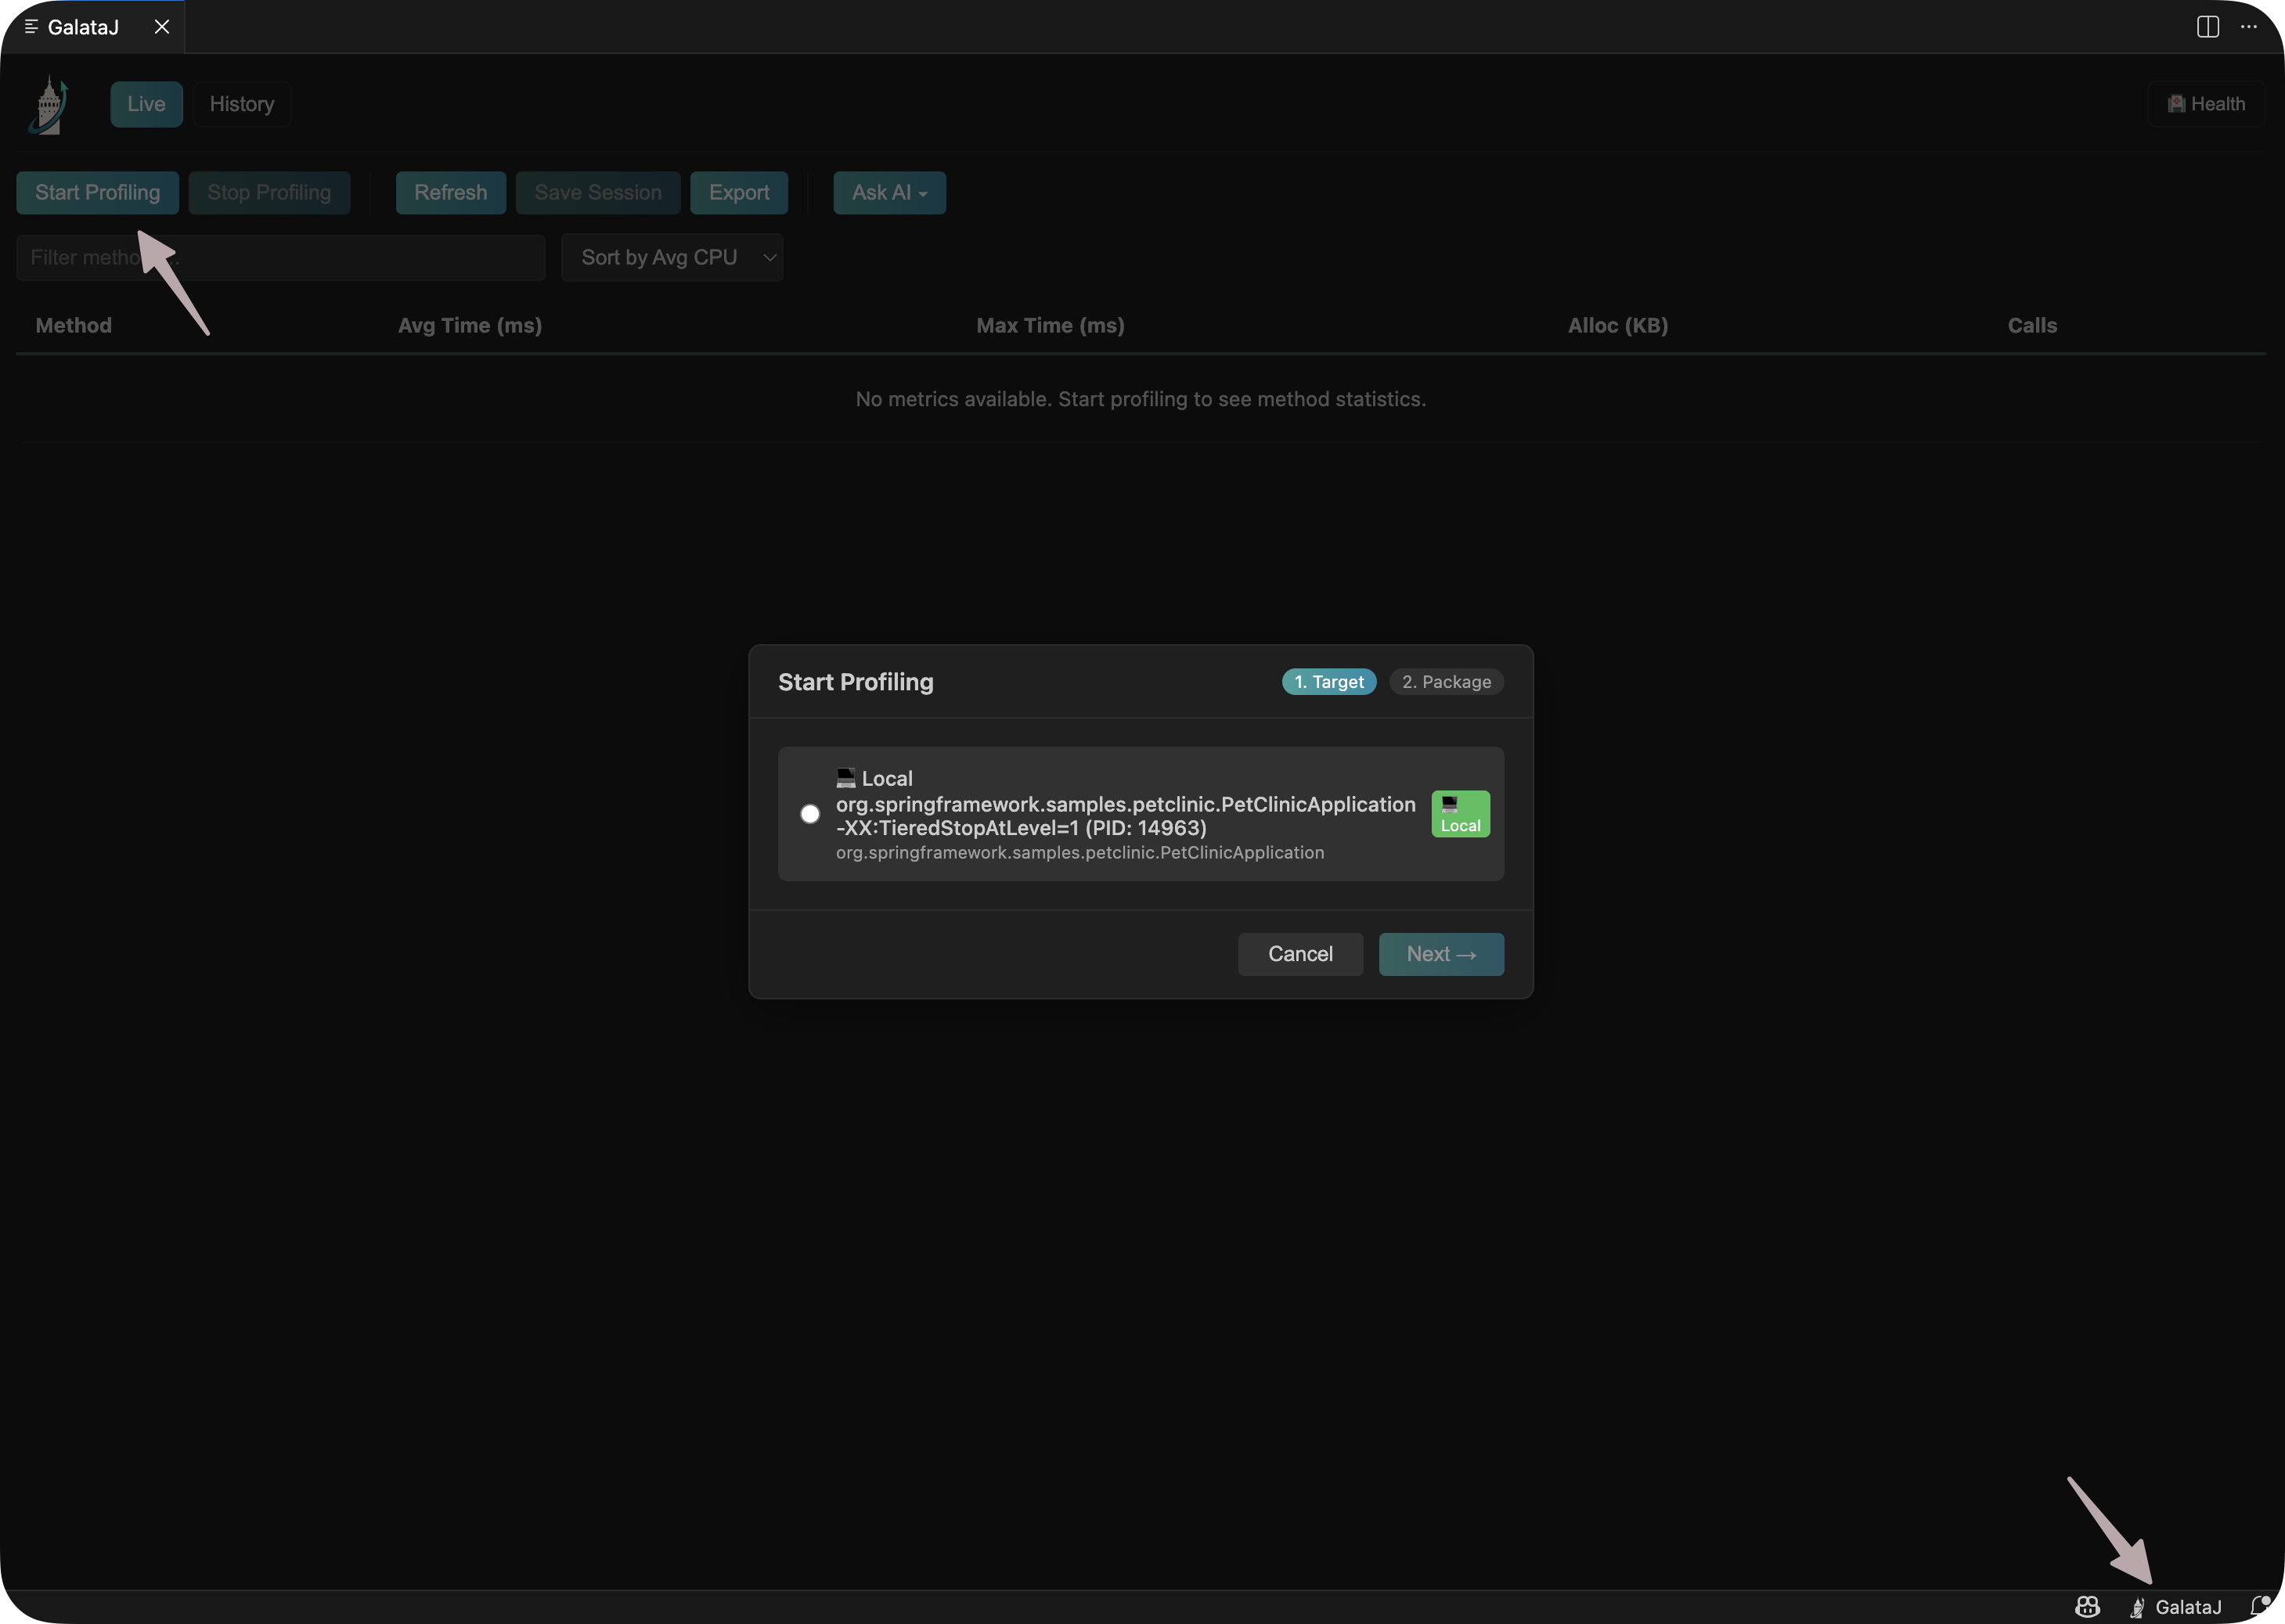
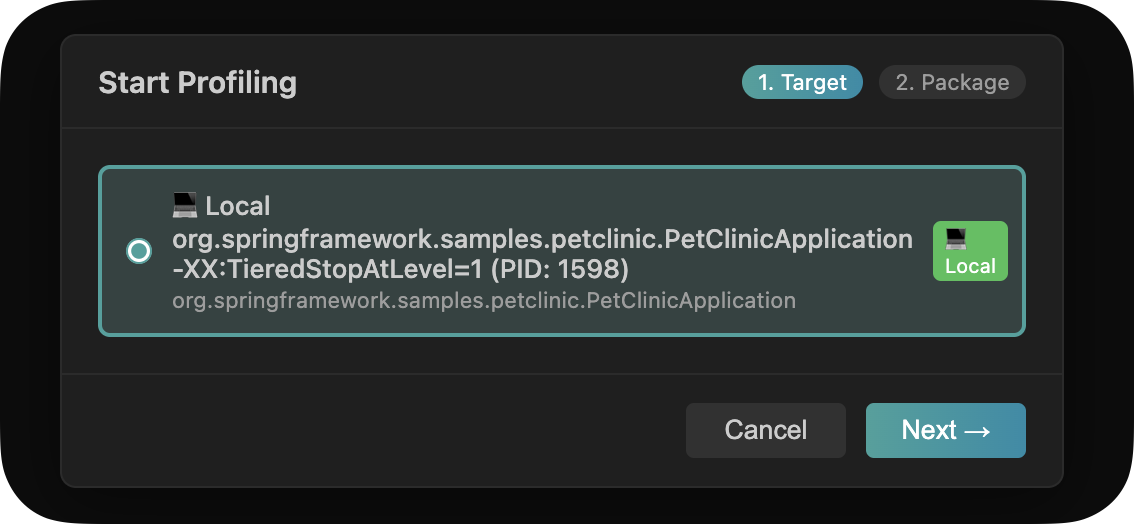
Step 4: Select Your JVM
Section titled “Step 4: Select Your JVM”A list of running Java processes appears. Click on yours.
That’s It!
Section titled “That’s It!”Performance metrics now appear directly in your code:
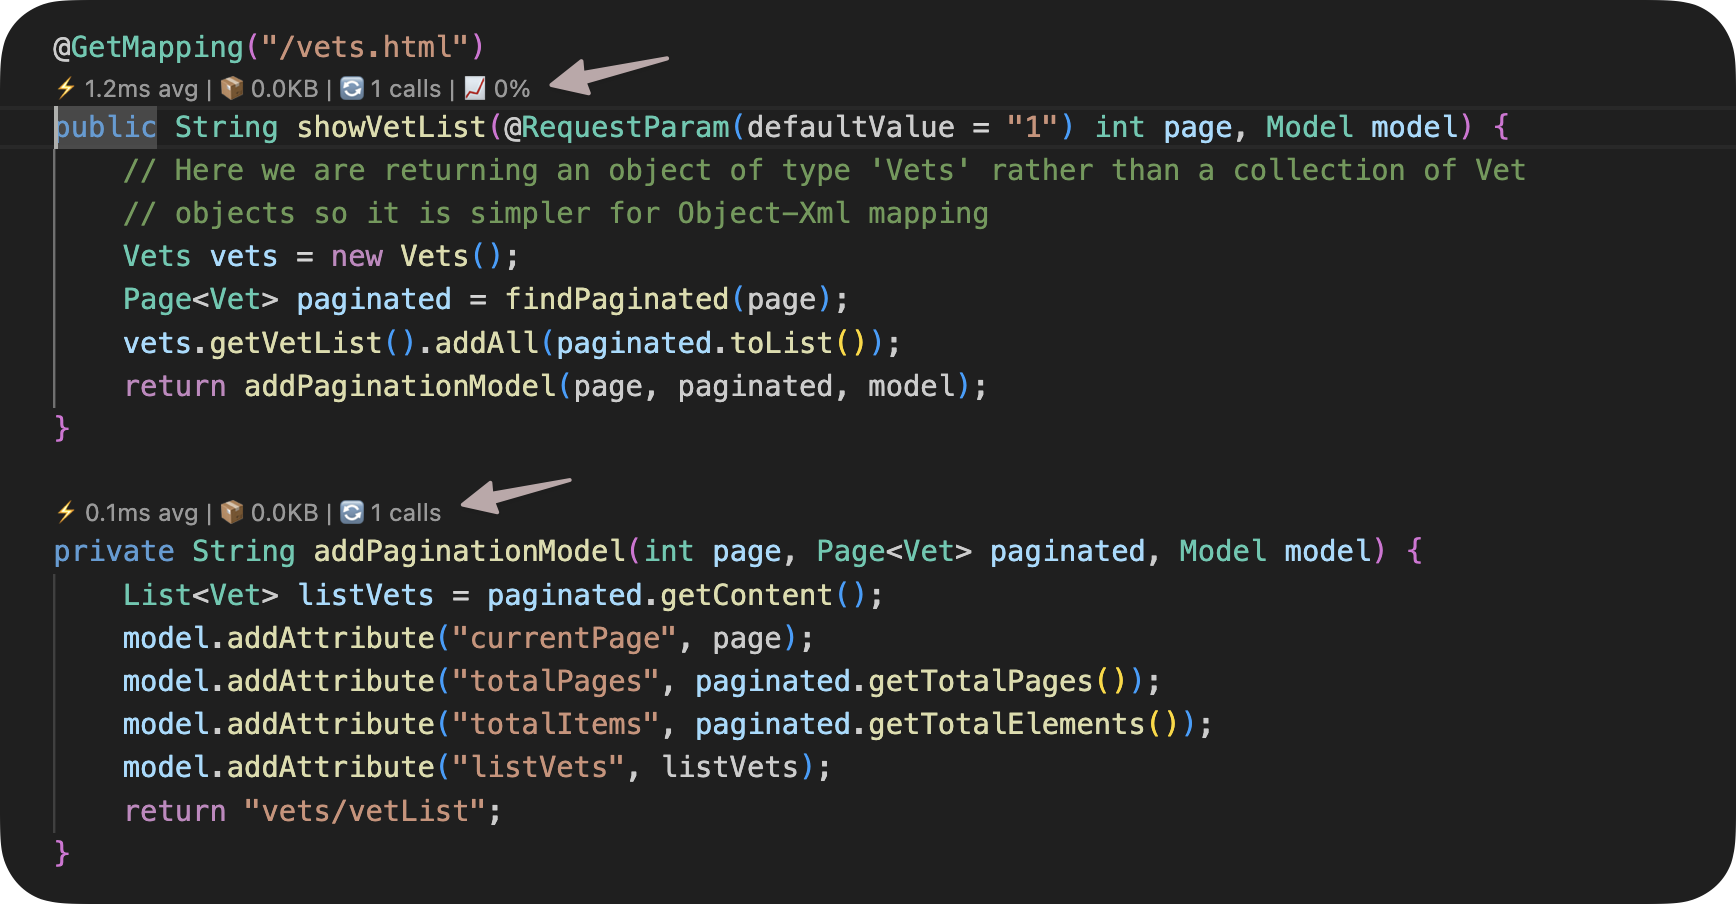
You’ll see:
- Execution time (avg/max)
- Call count
- Trend indicator
- Memory allocations
Something Not Working?
Section titled “Something Not Working?”Run Health Check
Open the Profiler panel and click Health. It will diagnose and fix most issues automatically.
Quick fixes:
- JVM not showing? → Click Refresh in the panel
- No metrics? → Check that you’re viewing files from the profiled package
- Panel not visible? → View → Tool Windows → Profiler (IntelliJ)