What is GalataJ?
GalataJ is a Java profiler that works inside IntelliJ IDEA and VS Code. It shows method-level performance metrics inline in your code, lets you compare profiling sessions to track regressions, and exports structured performance data for analysis — all without leaving your editor.
The workflow is simple: Profile → Compare → Act.
Bytecode instrumentation · ~3% overhead · Runtime auto attach · JDK 8+ · Windows, Linux, macOS
Profile → Compare → Act
Section titled “Profile → Compare → Act”1. Profile
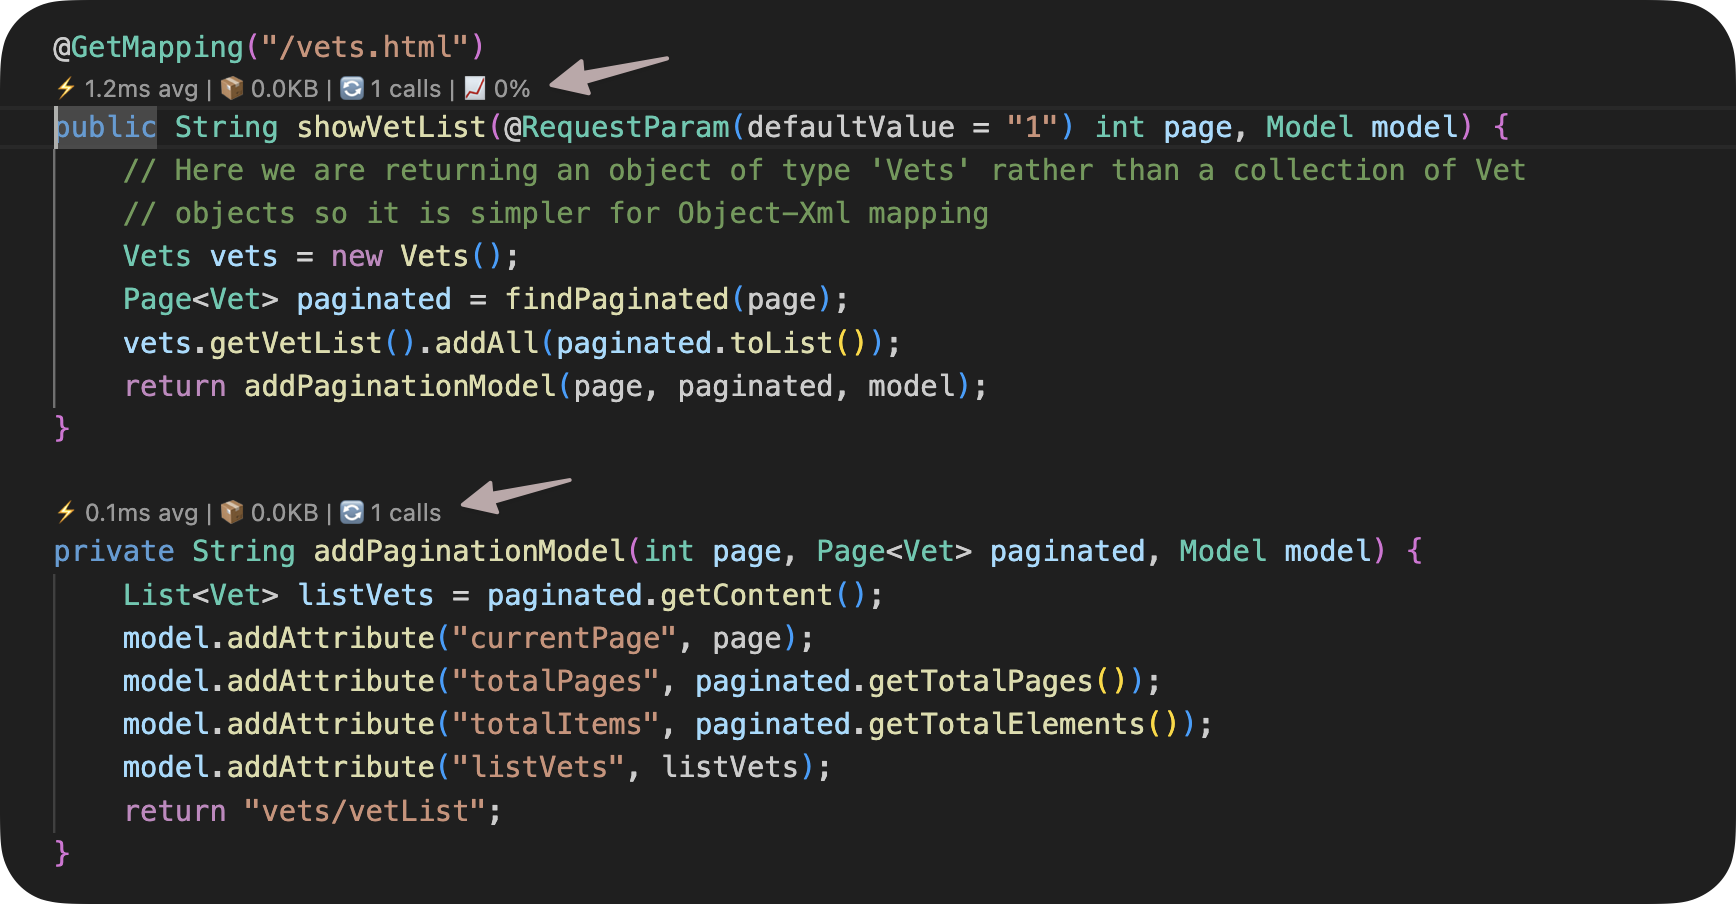
Section titled “1. Profile”GalataJ attaches to a running JVM and shows per-method metrics directly above your code as CodeLens/CodeVision hints:
- Execution time — How long each method takes
- Call count — How often it’s called
- Memory — Allocations per call
- Trend — Is it getting slower or faster?
Metrics update in real-time. A dedicated Live Profiler Panel provides a sortable, filterable view of all profiled methods.
Understanding Metrics → · Profiler Panel →
2. Compare
Section titled “2. Compare”A single profiling snapshot doesn’t tell you if things are getting better or worse. GalataJ lets you:
- Save profiling sessions and revisit them later
- Set performance baselines as a reference point
- Compare runs to see exactly which methods regressed — and by how much
This turns profiling from a one-time activity into a continuous performance tracking workflow.
3. Act
Section titled “3. Act”Profiling data exports as structured Markdown files in your project:
.galataj/live-performance.md— Real-time hotspots, trends, and method-level context.galataj/baseline-live-compare.md— Regression detection against your baseline
These files are plain text, version-controllable, and readable by any tool. Use them in code reviews, CI pipelines, or feed them to AI assistants for contextual performance analysis.
The Add to Chat button sends method context directly to your AI assistant (Cursor, ChatGPT, Copilot, etc.) with one click.
How It Works
Section titled “How It Works”GalataJ uses bytecode instrumentation to measure method execution time, memory allocation, and call frequency at the JVM level. It does not require source code changes, annotations, or build plugins.
| Instrumentation | Bytecode-level, no source code changes |
| Overhead | ~3%, suitable for development and testing |
| Attach method | Runtime auto attach — no JVM restart, no flags |
| Java versions | JDK 8, 11, 17, 21 and later LTS versions |
| Runtimes | OpenJDK, Oracle JDK, Amazon Corretto |
GalataJ is designed for development and testing environments. For production monitoring, use dedicated APM tools like Datadog or New Relic.
Supported Environments
Section titled “Supported Environments”IntelliJ IDEA
Community and Ultimate editions. Full CodeVision integration with tool windows.
VS Code / Cursor / Windsurf
Full CodeLens integration. Works in all VS Code-based editors.
Local JVMs
Profile any Java application running on your machine — Spring Boot, Maven, Gradle, standalone JARs.
Docker Containers
Profile Java apps inside local Docker containers with auto-discovery. (Pro)
Supported operating systems: Windows, Linux, and macOS.
Not supported: Remote server profiling, Kubernetes, distributed tracing.
Ready to Start?
Section titled “Ready to Start?”Install the plugin, run your Java app, and click “Start Profiling” — metrics appear in under a minute.